NGI Archives | NGI All News Access
NatGas Transactions Declined, Supply-Demand Mix Shifted in 2012
Total combined natural gas purchase and sales volumes were 123,868 TBtu (Bcf) in 2012, a 0.7% decline compared with 124,752 TBtu in 2011, according to an analysis by NGI’s Shale Daily of 2012 Form 552 buyer and seller filings with FERC.
More significantly, the supply-demand mix shifted last year, according to NGI’s analysis. Total purchases in 2012 were 61,389 TBtu, down 2.0% year-over-year, while total sales nudged up 0.6% for the year to 62,480 TBtu. That compares to respective 4.6% and 5.1% annual increases in consumption and dry gas production in 2012 (see Shale Daily, May 30, 2012).
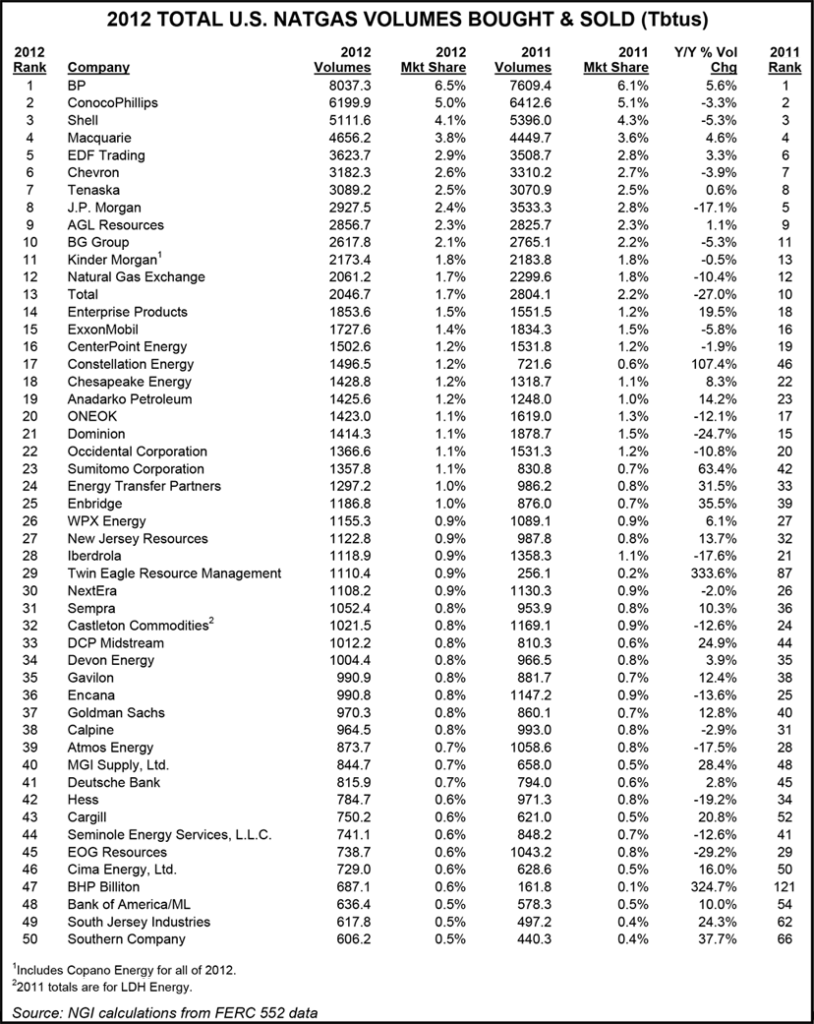
BP plc, ConocoPhillips, Shell Energy NA and Macquarie Energy once again were the top four companies in terms of total volumes transacted, with a combined 19.4% market share in 2012, compared with a 19.1% combined market share in 2011. And BP furthered its hold on the top spot in 2012, increasing its total volumes to 8,037 TBtu, good for a 6.5% market share. In 2011, BP had 7,609 TBtu and a 6.1% market share.
Among companies that made the Top 50 list for deal volumes in both 2012 and 2011, Constellation Energy, Sumitomo Corp. and Enbridge made the biggest gains, climbing 29, 19 and 14 spots, respectively, to push each company within the Top 25. Encana, Atmos Energy and EOG Resources all fell between 11 and 16 positions on the list, a result that may not be too surprising given that the goal of many exploration and production companies in 2012 was to focus less on dry gas and more on liquids production.
Total was the only company to fall out of the Top 10 rankings, slipping to No. 13, while BG Group moved up one spot to No. 10.
Newcomers to the Top 50 rankings in 2012 were Twin Eagle Resource Management (No. 29, up from No. 87 in 2011), Cargill (No. 43, up from No. 52), BHP Billiton (No. 47, up from No. 121), Bank of America/Merrill Lynch (No. 48, up from No. 54), South Jersey Industries (No. 49, up from No. 62), and Southern Company (No. 50, up from No. 66).
Falling out of the Top 50 were Citigroup (non-ranked in 2012, vs. No. 14 in 2011), Direct Energy Marketing (No. 75, down from No. 30), Gazprom (No. 70, down from No. 37), Barclays Bank (No. 51, down from No. 43), National Energy & Trade (No. 53, down from No. 47) and QEP Resources (No. 55, down from No. 49).
U.S. natural gas production totaled 29.77 Tcf in 2012, the seventh consecutive year-over-year increase, and both marketed production and dry gas production increased compared with 2011, according to the U.S. Energy Information Administration (EIA). But numbers in all three categories slipped in early 2013 compared with the year-ago period, EIA said.
Companies must fill out and file a Form 552 report annually if either their sales or purchases run more than 2 trillion Btu. Only arms-length physical gas transactions that are tied to a day-ahead or month-ahead index, or that contribute to, or are eligible to be contributed to the formation of a gas index are reported. That necessarily excludes bundled (gas plus transportation) retail sales by utilities at a tariff rate, or sales and purchases outside the day-ahead or month-ahead markets. Companies may aggregate affiliate data or file separately. For its analysis NGI aggregated all affiliate data to get company-wide totals.
© 2024 Natural Gas Intelligence. All rights reserved.
ISSN © 2577-9877 | ISSN © 2158-8023 |
