NGI Archives | NGI All News Access
Texas Petro Index Charts Second Consecutive Monthly High
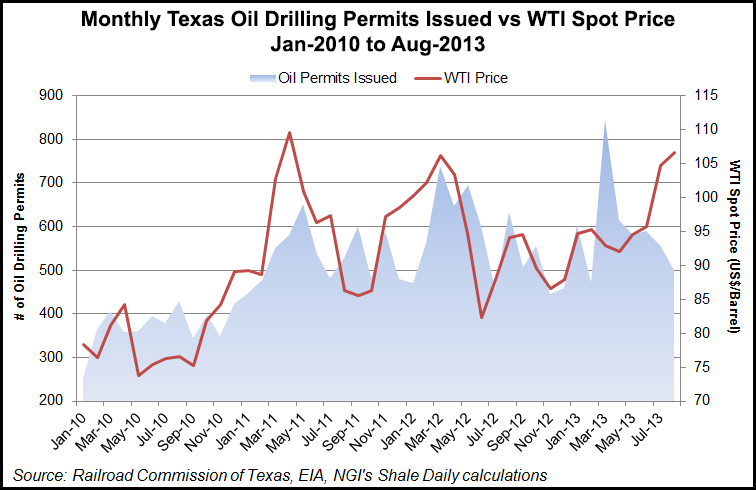
Robust crude oil production in August lifted the Texas Petro Index (TPI) to its second consecutive monthly record while the state’s oil and gas industry charted a new record as well. But a downturn in the number of drilling permits issued suggests that things might slow in the months ahead, an economist said.
“The Texas Petro Index continued its march into record territory in August, rising to 289.8,” said Karr Ingham, the economist who created the TPI and updates it monthly. That eclipsed the old record, set in July (see Shale Daily, Sept. 6), which itself was revised upward by Ingham to 288.2 from 287.7 due to ongoing, upward revisions of Texas oil production since the July 2013 TPI was released less than 30 days ago.
Ingham credited the TPI strength to “dramatic upward revisions of crude oil production” (see Shale Daily,Oct. 1) combined with strong crude prices and strengthening natural gas prices.
But the TPI also revealed that state regulators issued only 1,606 drilling permits, the fewest during any August since 2009, when oil and gas activity was in sharp decline, Ingham said. “Fewer permits to drill could exert downward pressure on upstream oil and gas activity in the coming months.”
Also contributing to the record TPI in August were natural gas prices, which lifted exploration and production (E&P). “While still lower than during the gas-driven expansion of Texas E&P activity from 2003 to 2009, they were solidly improved compared to year-ago levels and, thus, are providing upside support to the TPI rather than acting as a drag,” Ingham said.
In addition to the sharp decline in the number of drilling permits granted, drilling activity in August was slightly lower than in August 2012, exerting downward pressure on the TPI. However, the statewide rig count this year has climbed slowly but steadily after declining in the second half of 2012.
“Each working rig represents considerable associated economic activity in terms of employment, services provided to the rig and to the well, lease and royalty payments, and so on,” Ingham said. “However, the historic relationship between drilling permits and rig activity is evolving because technological advances enable several wells to be drilled from the same pad with the same rig [see Shale Daily, Sept. 25].
“Nevertheless, the rig count remains an important upstream economic indicator, however, simply because it clearly shows a positive correlation with price; when prices go up, so does the rig count, and when prices go down, the rig count does the same.
“Ultimately,” Ingham said, “crude oil pricing will determine the direction of the TPI over the coming months; if prices remain above $100 per barrel ($/bbl) — or even in the $90-95/bbl range — the rig count will continue its steady improvement, drilling permits will stabilize or increase, and the industry will continue to add jobs. And at this point, all of that seems very likely.”
The TPI is a composite index based upon a group of upstream economic indicators. Before the current economic expansion, the TPI’s previous all-time high of 287.6 occurred in September and October 2008, after which the TPI declined to 188.5 in December 2009 before embarking upon the current growth cycle.
© 2024 Natural Gas Intelligence. All rights reserved.
ISSN © 2577-9877 | ISSN © 2158-8023 |
