NGI Archives | NGI All News Access
Shale Map Doesn’t Chart Costs, Coming Demand, Economist Says
Checking a map is the first step to knowing where one is going, but when it comes to forecasting shale gas supply and demand, the map can throw some international gas end-users off course.
Take the Energy Information Administration’s (EIA) widely seen map of shale plays. It has perhaps misled a few international observers about the availability of the North American gas resource base, said Michelle Michot Foss, chief energy economist for the University of Texas at Austin’s Bureau of Economic Geology (BEG).
“…[E]verywhere I go and everything I attend, that’s the first thing that usually gets rolled out is that beautiful EIA map showing all of the locations of all of the shale basins and they’re all big red blobs. What happens is, outside of our country, people look at that and they think that means that there’s gas in all of the areas in those big red blobs on those maps,” Foss told attendees at ICBI’s Floating LNG 2013 conference in Houston Tuesday. “Nothing could be further from the truth.”
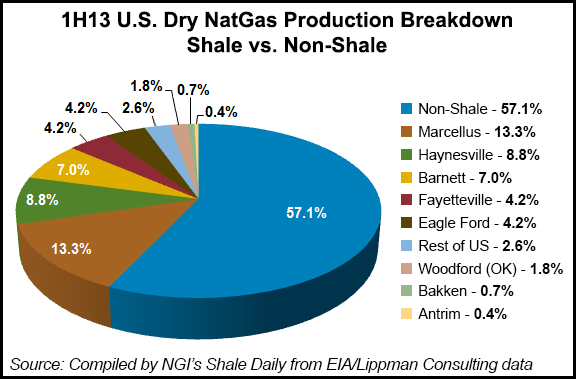
In fact, while shale gas production is edging up, most U.S. dry gas production is still coming from non-shale targets. According to EIA data and NGI‘s Shale Daily calculations, 57.1% of U.S. dry gas production during the first half of 2013 came from non-shale plays (see chart).
While Foss supports the export of North American liquefied natural gas (LNG) to international markets, the gas won’t be available unless producers are paid what they need to produce. Shale plays are anything but uniform in productivity and economics. And further, domestic demand for gas is on the rise across multiple sectors, faster than some people currently imagine, Foss told the international audience.
Starting in the shale patch, producing gas is a bit more complicated than sticking a straw into one of the blobs on EIA’s map. Hydrocarbon presence isn’t uniform across any given play, and once gas/oil are found, the resource might not be as abundant as initially thought; recoveries could be lower than expected and decline curves steeper than anticipated. “…[W]ith all of those things, plays can deteriorate pretty quickly,” Foss said. “…It’s a long progression from idea to reality, from the big resource numbers that people toss around in plays just getting off the ground to numbers that you’re comfortable looking at with your regulators.”
But from a customer point of view, deliverability is all that matters. “What are you going to deliver in volumes on any one day and at what price to the customers that you’re serving? Bottom line, this is what people really care about.”
BEG has been studying U.S. shale plays and earlier this year released its findings on the Barnett Shale (see Shale Daily, March 1). “The major accomplishment so far has been to prove that sweet spot geology is really what’s driving a lot of this stuff…” Foss said. “It is pretty much telling us what we already knew, which is that you really want to be leasing and drilling in the best parts of these basins, and you really don’t want to be in the marginal acreage if you can help it unless you’ve got a really strong commodity price…and really favorable conditions.”
The message is that the cheap gas that has been around for a while isn’t going to stay forever, she said. After several years of benchmarking producer costs, Foss said BEG has come up with an all-in, full-cost average of $6/Mcf, which includes a 10% return, admittedly lower than many producers would like.
Much of the gas being produced in the Lower 48 today is associated with liquids and supported by the higher prices they still garner, Foss said. Associated gas accounts for somewhere between about 35% and 40% of gas being produced today. If liquids prices fall, then “something needs to happen on the methane side” to keep the gas coming, she said. “We need a $6 gas price target at some point to sustain the interest of the industry in drilling.”
The cost side argues for higher gas prices; so does demand. “Demand buildout is real,” Foss said, citing growth in petrochemical and industrial end-users on the Gulf Coast and expansion of natural gas-fueled power generation, which started at the beginning of the shale boom and continues unabated.
BEG has tallied up about 28 Tcf of annual U.S. gas consumption by 2020 based on commitments in the industrial and power sectors, Foss said. That’s 2 Tcf above what EIA is forecasting. BEG has been modeling power dispatch for about two years and currently projects 11 Tcf of annual demand from power generators by 2020. “…[T]here doesn’t see to be anything to stop it. We seem to be doing a very good job of putting our coal industry out of business. I suspect we’ll probably regret that at some point down the road.”
Foss acknowledged being more bullish on power demand than many in the power industry who are puzzling over how much organic growth can be achieved with the last recession not such a distant memory. “We think that there’s too much doom and gloom in the power industry,” she said. “It doesn’t take time; it doesn’t take anything really…to reach limits on reserve margins…”
Then there are natural gas exports, the other kind, via pipeline, which are substantial and growing long before the first tanker of domestically sourced LNG has left port. “Currently, the United States makes up about 20% of the total gas supply in Canada,” Foss said. “We also make up about 20% of total gas consumption in Mexico. And both of those things are going to grow. Mexico will easily double. The Canadians really don’t have many good options for trying to move British Columbia gas east over the Rockies; it’s a big problem.”
In the end, there’s plenty of shale gas in the Lower 48; it’s all over the map. What’s not on the map are the supply expectations of domestic consumers and the dollars that producers need to keep drilling and producing.
“It’s all about the economics of being able to sustain drilling and sustain production in these plays and the price signals that producers get,” Foss said. “The demand response has been powerful. It’s real.”
© 2024 Natural Gas Intelligence. All rights reserved.
ISSN © 2577-9877 | ISSN © 2158-8023 |
