NGI Archives | NGI All News Access
Well Freeze-Offs Muddling NatGas Production Data, Says Barclays
Determining whether Lower 48 state natural gas onshore production is falling is proving to be a difficult task because of the variable winter, but the aggregate amount of production curtailments from well freeze-offs “point to peak supply losses of as much as 1.8 Bcf/d,” according to Barclays Capital.
The recent rally in U.S. natural gas prices has offered more attractive levels for producers to hedge 2013 and 2014 production, but it’s doubtful that the latest price increases will lift the rig count in the onshore, Barclays analysts Biliana Pehlivanova and Shiyang Wang wrote in a note Tuesday.
Based on the review, they revised their average gas price forecast for this year upward to $3.90/MMBtu from a December forecast of $3.70. Prices are expected to average $4.00/MMBtu in 2Q2013 and 3Q2013, then rise to $4.10 in the final period. However, the analysts said they still don’t expect the domestic gas rig count to break 450 this year, as they said last week (see Shale Daily, April 1).
“Higher prices could bring higher gas-directed drilling,” wrote the Barclays analysts. “However, the magnitude of this price increase would not be sufficient to alter our expectations for the trajectory of drilling meaningfully. We had expected the gas-directed rig count to hover between 400 and 450 rigs in 2013. It has averaged 423 rigs since the beginning of the year, with a drop below 400 last week.
“The recent price rally has offered more attractive levels for producers to hedge 2013 and 2014 output, and some rigs could be put into operation as a result. Any rebound in drilling, however, would likely be limited to 20-30 rigs and could push the rig count only to the top of our estimate range, but not above it.”
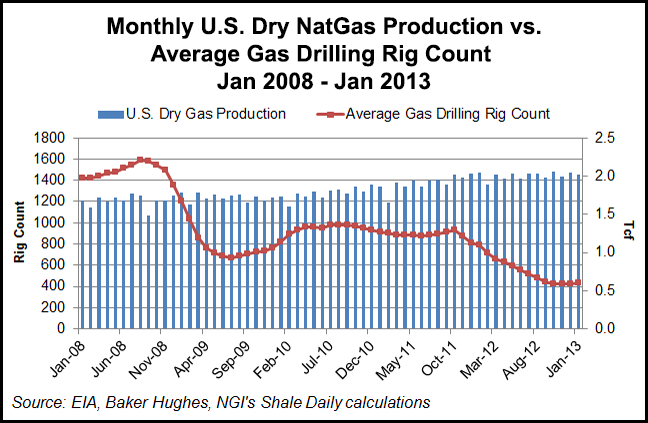
The average natural gas drilling rig count, which peaked at 1,589 in Aug. 2008, tumbled by more than half over the next 12 months to 672 in July 2009, and has been below 600 since May 2012, according to NGI’s Shale Daily calculations. But that precipitous decline hasn’t had any significant effect on dry gas production: total U.S. production was 1.74 Tcf in Aug. 2008, was only marginally lower in July 2009 and had grown to 2.02 Tcf by Jan. 2013.
Late winter cold boosted gas consumption, but the trajectory for domestic gas supplies largely has remained unchanged, said the analysts. They took another look at regional output to determine if there had been any changes since a review in early January determined that outside of the “headline” shale plays, there had been a slow decline in production in the U.S. onshore (see Shale Daily, Jan. 11).
“Output in the Fayetteville has essentially stabilized at 2.9 Bcf/d as of December 2012, and we maintain our expectation for a modest pullback in 2013. The Marcellus continues to grow, adding an average of 107 MMcf/d in each of the past three months. Drilling activity in the play has leveled off, and a large backlog of wells remains. Along with a significant amount of pipeline and processing capacity additions, this will support the play’s pace of output growth in 2013, in our view.”
Meanwhile, data on Texas oil production and an estimate on associated gas, as well as gas output in the Bakken Shale in North Dakota “have tracked our earlier projections as well. The declines in ‘all other’ areas of the country appear steeper than we had projected, but are distorted by well freeze-offs.”
Winter temperatures averaged close to 10-year norms in aggregate for the season, and the number of heating degree days recovered by 17% from 2012 levels. However, “these statistics are deceiving” because November was colder than usual, while there were unseasonably warm temperatures in December and January. February weather was in line with historical norms. “Then came an exceptionally cold March…”
The well freeze-offs had a bigger impact on production than many thought, causing “jarring disruptions to supply at times this winter,” wrote the analysts.
“Well freeze-offs cut production in December, January, February and March. The aggregate amount of production curtailments in each month is difficult to estimate, but pipeline flow data point to peak supply losses of as much as 1.8 Bcf/d.”
Well freeze-offs also distorted the production data in the 2011 and 2012 winters. Barclays said a historical analysis by the Energy Information Administration puts February 2011 well freeze-off production disruptions “rivaling those inflicted by major hurricanes.”
Lower 48 state dry gas output fell in December and January, and while Barclays has been anticipating output to tip into declines later this year, “these sharp declines are largely a result of adverse weather effects and are not an accurate reflection of underlying production trajectory, in our view. Unfortunately, the freeze-offs will muddle production data and obscure underlying trends in the next two monthly data releases.”
Pipeline flow reports “provide a more contemporary perspective on current production dynamics,” but data revisions aren’t uncommon, they added.
“We expect U.S. Lower 48 production to average 64.59 Bcf/d in 2013, down 0.13 Bcf/d from last year, and highlight the uncertainty that freeze-offs pose to production data in the near term.”
© 2024 Natural Gas Intelligence. All rights reserved.
ISSN © 2577-9877 | ISSN © 2158-8023 |
