NGI All News Access | LNG | LNG Insight
Natural Gas Forwards Plunge as LNG Demand Sinks Underwater; AECO Losses Not as Steep
Faced with a massive decline in liquefied natural gas (LNG) demand and a slow reopening of the economy amid the coronavirus pandemic, natural gas forward prices collapsed during the May 7-13 period, NGI’s Forward Look data show.
Prices through the remainder of the summer plunged by more than 20 cents on average, while the winter strip (November-March) tumbled an average of 11 cents, according to Forward Look. Smaller losses of around 5.0 cents were seen further out the curve, including for the calendar (Cal) year strips.
“The decline in LNG is coming at a time when supply/demand balances are already running quite loose, even with production much lower than a few months ago,” Bespoke Weather Services said.
After reaching late-November highs above 96 Bcf/d, U.S. production has moved notably lower since. As of early Friday, Bespoke’s data showed the top-day figure at around 85.0 Bcf.
However, the steep drop-off in output pales in comparison to the demand destruction that’s taken place. The spring season has finally sprung across the Lower 48 after a late-season cold blast made for a snowy Mother’s Day in parts of the East, and the warmer temperatures have sapped what little demand remained amid continued shutdowns related to Covid-19.
Global appetite for gas isn’t much better, and NGI’s U.S. LNG Export Tracker showed feed gas volumes at around 5.7 million Dth on Friday, off from about 7 million Dth on May 9.
More than 30 LNG cargoes reportedly have been canceled at U.S. facilities for June, with estimates pointing to more cancellations in the months ahead. EBW Analytics Group pointed out that the 20th day of each month is a contractual date when some offtakers must declare their intention to lift or cancel LNG cargoes. Although exporters have kept data close to the vest, the risk of significant cancellations could be an impending bearish signal for the market, EBW said.
“Reported cancellations will likely understate actual cancellations, as only cancellations that make their way to the public domain are reported,” according to the firm. “Since last month, however, Henry Hub premiums to European Transfer Title Facility have flipped from marginally positive to negative through September, even before accounting for liquefaction costs, shipping costs, loading and regasification fees, brokers fees, insurance and more.”
The glut of U.S. supply that could remain in the domestic market doesn’t bode well for storage inventories, which are already tracking well above historical levels following an usually mild winter and now, the coronavirus. On Thursday, the Energy Information Administration (EIA) reported a 103 Bcf injection for the week ending May 8, coming in slightly higher than last year’s 100 Bcf build and well above the 85 Bcf five-year average build.
Bespoke, which had projected a 105 Bcf injection, viewed the EIA report as “pretty neutral” given market expectations but said the figure once again confirms “very loose” supply/demand balances.
Broken down by region, the South Central region led with a 32 Bcf injection, which included a 24 Bcf build into nonsalt facilities and a 9 Bcf build in salts, according to EIA. The East added 28 Bcf to stocks, and the Midwest added 24 Bcf. Pacific inventories rose by 12 Bcf, while Mountain stocks climbed 6 Bcf.
Total working gas in storage as of May 8 was 2,422 Bcf, 799 Bcf above year-ago levels and 413 Bcf above the five-year average, EIA said.
With the June Nymex contract plunging 28 cents between May 7 and May 13, the sell-off has headed off EBW’s projections for a surging year/year surplus, although maintaining inventories 750-800 Bcf above year-ago levels “may become increasingly untenable as the summer wears on,” according to the firm.
When the market comes to terms with an enormous surplus failing to decline meaningfully, and rebounding supply as oil and associated gas well shut-ins are restarted, more bearish pressure could emerge, EBW said. Furthermore, demand weakness through increased LNG cargo cancellations and weaker domestic economy could result in “pronounced” downside price risks for the July, August and September natural gas contracts, “even after this past week’s declines.”
As of Wednesday, the June Nymex contract stood at $1.616. The balance of summer (June-October) moved to $1.91 after falling 25.0 cents since May 7. The winter strip dropped 11.0 cents to $2.760, while prices for next summer (April-October) slipped only 4.0 cents to $2.540. The Calendar 2021 (Cal2021) strip fell to $2.650.
Though prices were slightly higher by Friday, Goldman Sachs analysts viewed the recent action as a needed correction, though they maintained a balance of summer forecast of $2.04. However, analysts noted that lower production shut-ins, exports and domestic demand relative to the firm’s May expectations suggest downside risks to the forecast.
“We believe the continued uncertainty regarding how these drivers evolve in the coming months will likely keep U.S. gas prices volatile,” said the Goldman analysts. “It is important to emphasize that the high storage levels we expect at the end of this summer, which in our view keep the upside to summer 2020 Nymex gas prices capped, will likely be needed as the market transitions to a much tighter balance from this next winter. Accordingly, our $3.25 Cal2021 gas price view remains bullish relative to the market.”
Markets across the United States closely mirrored the slide in Nymex futures. However, north of the border, Western Canadian forward prices, though lower, failed to produce the same level of losses as those seen in the Lower 48, according to Forward Look.
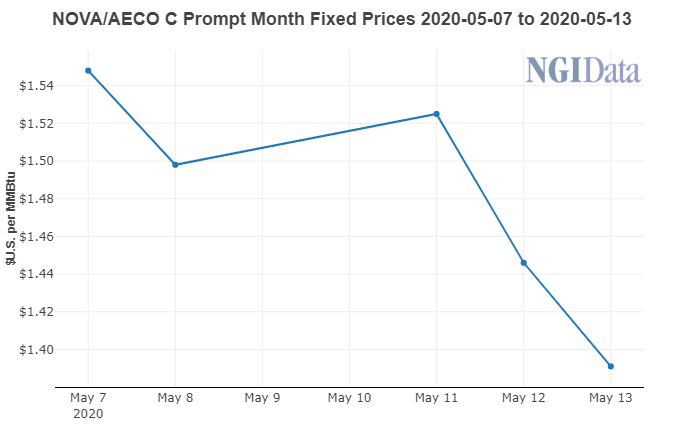
NOVA/AECO C June prices fell 16.0 cents from May 7-13 to reach $1.391. The lower-than-average decline marked a 12-cent increase in basis prices for the six-day period. The balance of summer dropped 19.0 cents to $1.45, resulting in a basis gain of 7 cents.
Further out the curve, winter prices were down 9.0 cents to $1.85, and summer 2021 slipped 4.0 cents to $1.720, Forward Look data show.
Although reduced oil demand from refineries in Western Canada could lead to much lower natural gas consumption in the province, analysts expect it to rebound as early as June.
In a recent note, Tudor, Pickering, Holt & Co. (TPH) said Canadian oil imports the first week of May were at 2.897 million b/d, a drop of around 750,000 b/d from February’s average. Put in the context of around 150,000 b/d of reduced runs from Western Canadian and Ontario refineries would suggest as much as 900,000 b/d of declines and shut-ins from early 1Q2020 levels.
As with U.S. volumes, TPH analysts suspected “a healthy portion” of the volumes may reverse course in June if tight differentials and West Texas Intermediate prices above $25/bbl hold course.
The TPH team noted that oil exports also have remained resilient at around 3.5 million b/d, which was in line with the previous week, “though we continue to see downside in the coming weeks and into June delivery.”
RBN Energy LLC also examined the impacts to natural gas demand in Western Canada given the slowdown in oilsands production. The analytics firm looked at the data in the context of the last time oilsands production was seriously curtailed — during the Fort McMurray wildfires in April and May 2016.
During the wildfires, bitumen production in the oilsands declined by about 1 million b/d, from an average of 2.63 million b/d in March 2016 to its low point of 1.60 million b/d in May. Oilsands demand for gas use during that time fell by one-third, from 2.44 Bcf/d on average in March to 1.62 Bcf/d in May, for an average reduction of 0.82 Bcf/d, according to RBN.
“The seasonal demand swing from the end of winter into May is typically very small for the oilsands, so nearly all of the gas demand drop four years ago was due to reduced bitumen output,” said RBN analyst Martin King.
Applying similar oilsands output and gas demand reductions this year as in 2016, and stretching the impact through October, RBN calculated the average oilsands gas demand loss for the seven-month span of 0.4 Bcf/d in a worst-case scenario.
Like TPH, RBN assumes that refinery demand starts to recover into June as Covid-19 disruptions to gasoline demand begin to ease, initiating a slow drawdown in inventories. The seven-month outlook also assumes “some very modest recovery” in Canadian heavy oil prices from the single-digit values that have been seen of late, King said.
Of course, the analyst noted that what North American and global energy markets are going through is “unique and unprecedented.
“In what seems like an instant, demand for crude oil plummeted by 25% or more, and the resulting price crash was exacerbated by a short-lived, but market-shocking price war between the Saudis and the Russians. This is all very different from what happened in 2016.”
© 2024 Natural Gas Intelligence. All rights reserved.
ISSN © 1532-1231 | ISSN © 2577-9877 |