Near-Term Natural Gas Forwards Slide as Demand Softens; Winter Strip, Beyond Climb on Projected Supply Cuts
Demand destruction spurred by Covid-19 hit the front of the natural gas forwards curve during the March 26-April 1 period, with prices sliding about a dime on average through the balance of the summer (May-October), according to NGI’s Forward Look.
However, the back of the curve found some support from expected production losses that were seen playing out over the coming months as result of a pullback in spending and activity among exploration and production (E&P) companies from the oil price war. Winter strips (November-March) averaged 6 cents higher while summer 2021 prices jumped an average 8 cents, Forward Look data show. Calendar year strips also posted solid increases.
With weather taking a back seat to the demand destruction caused by the coronavirus pandemic, natural gas traders looked to the latest government storage data for the first indications of how much demand already has been lost. On Thursday, the U.S. Energy Information Administration (EIA) reported that 19 Bcf of natural gas was withdrawn from storage inventories for the week ending March 27, a figure that was several Bcf shy of consensus but fell within a broader range of estimates that were as low as 16 Bcf and as large as 31 Bcf.
Responses to a Bloomberg survey clustered around a withdrawal of 31 Bcf, while a Wall Street Journal poll averaged a 26 Bcf pull. NGI’s model had projected an even smaller 10 Bcf draw.
“This reveals a little more demand destruction having taken place versus last week, and a rather loose market,” Bespoke Weather Services said. “Obviously, these price levels are factoring in a lot of demand destruction already, but what we have no clue on is the duration, and that is ultimately what makes the market a more difficult trade in the near term.”
For now, buyers are decidedly in the driver seat, and the question of how many buyers are out there currently is the driving force in the market, according to Mobius Risk Group. Although curve shape delivers a substantial incentive to store as much natural gas as possible, unknown burner tip bid depth causes confusion, the firm said.
“Exacerbating this issue are the MMBtus being dumped out of utility storage, which must be cycled before injections begin en masse.”
In Genscape Inc.’s latest Forward Supply & Demand Weekly report, currently traded forward curves were guiding end-of-summer 2020 inventories to a “somewhat reasonable” 3.86 Tcf. “However, we are frequently warning that number is poised to escalate to potentially infeasibly high levels as the demand destructive elements of the Covid-19 pandemic precede and outpace the production reductive components,” senior natural gas analyst Rick Margolin said.
The EIA’s reported draw compares with last year’s 6 Bcf injection for the similar week and matches the five-year average withdrawal of 19 Bcf.
Broken down by region, the East and Midwest each withdrew 16 Bcf out of inventories, while the South Central posted a net 11 Bcf injection, EIA said. This included a surprising 14 Bcf build in nonsalt facilities, and a 2 Bcf draw from salts.
Total working gas in storage as of March 27 was 1,986 Bcf, 863 Bcf above year-ago levels and 292 Bcf above the five-year average of 1,694 Bcf, according to EIA.
With E&Ps moving quickly to weather the sub-$30/bbl oil price environment, analysts continued to struggle to adequately capture the fallout of reduced activity on production. Monthly EIA production data released through January revised estimated production levels downward, reducing baseline supply by 0.39 Bcf/d for November and December. Meanwhile, the January figure was in line with EBW Analytics Group’s estimates for 0.75 Bcf/d of production declines.
“Still, recent pipeline flow estimates have shown supply increasing with the end of winter, a stark contrast to recent market concern with falling production,” EBW said. “We believe that associated gas output is likely to fall more slowly than crude production.”
Backing up this theory, EBW pointed out that the first North American crude wells to be shut-in are likely to be Canadian oilsands and older vertically drilled wells that produce little associated gas. “In fact, reducing Canadian oilsands production, which consumes natural gas to produce oil, will increase the amount of natural gas supply on the market,” the firm said.
The pace of the falling rig count reflected in the most recent Baker Hughes Co. proved to be much faster than Genscape had projected, and the firm has revised its rig forecast lower. In the latest weekly production forecast update issued on March 30, analysts said Lower 48 rigs came in 15 rigs below forecast for the month, with gas rigs coming in two below forecast and oil rigs 13 below forecast.
“For the purpose of comparison, U.S. rigs fell by 60% from September 2008 to May 2009 and by 80% from October 2014 to May 2016,” Genscape said. “Our projection is calling for a 49% retrenchment from the peak in November 2018 to the trough in November 2020, which indicates a shallower decline over a longer time frame from peak to trough compared to what the market saw in 2015-2016.”
The United States’ emergence as a top exporter of liquefied natural gas (LNG) means that global economics now play a much larger role in domestic gas prices. As global demand continues to crumble from the Covid-19 outbreak, so too does feed gas demand in the Lower 48.
NGI’s U.S. LNG Export Tracker showed delivered volumes on Friday falling more than 700,000 Dth day/day to just under 8.3 million Dth. Feed gas deliveries hit a weekly high of 9.29 Dth on Tuesday.
However, analysts remain unsure of the magnitude of U.S. shut-ins over the coming months. Economic projections have become increasingly bleak as the magnitude of the public health crisis has magnified, and although some economists foresee a sharp economic recovery ahead, there are fears of another wave of the virus later this year, EBW said.
A second Covid-19 outbreak and lingering economic damage from the initial spread may continue to meaningfully reduce demand for natural gas well beyond the second quarter, according to the firm.
“LNG exports, in particular, are increasingly likely to face reduced operation and feed gas consumption this summer, as there does not appear to be sufficient global demand for gas,” EBW said.
The firm pointed out that U.S. LNG pioneer Cheniere Energy Inc. reportedly has purchased six cargoes for delivery to Europe this summer, “potentially suggesting that the largest U.S. exporter plans on using market supply to meet demand rather than produce at full capacity. If these bearish projections play out, natural gas prices are likely to come under strong downward pressure over the next 45-60 days.”
However, Refinitiv’s Reza Haidari, director of Natural Gas, LNG and Coal research, does not see a major threat of prolonged economic shut-ins this summer for U.S. LNG. However, he noted that the super-chilled fuel is expected to find itself in a “precarious” situation amid the demand loss in Europe.
Furthermore, with current Japan Korea Marker swaps and European gas hub forward curves teetering around the level of variable export costs (115% of Henry Hub plus transportation costs), some offtakers with uncommitted cargoes may decide not to lift their volumes.
“However, for the third quarter, the economics turn critical,” Haidari said. “For northeast Asia, exports are not viable when taking into account the current full variable costs, and for northwest Europe, the contribution margin is close to zero.”
There are signs emerging, though, that some Asian demand is beginning to recover as China and others are gradually resuming commercial activity, according to RBN Energy LLC. In the past week, there were more cargoes moving to Asia than to Europe for the first time since November, “potentially signaling the start of the shift toward Asia,” analyst Sheetal Nasta said.
The hits to North American producer budgets and activity keep coming, but how those cuts play out in the coming months is still anyone’s guess. However, analysts are starting to agree that any projected decline in production is likely to take shape similarly to that of a “slow-motion train wreck” rather than an “abrupt cliff-dive.”
There are several factors that work to delay the inevitable production slowdown, Nasta said. These include the completions of the revenue-generating drilled but uncompleted wells (DUC), a focus on the “absolute best” drilling locations and the resulting efficiency gains, and the number of older wells now in their steady-state decline phase, according to the analyst.
Nevertheless, the gas market is entering the maintenance season, when midstream companies utilize the lower-demand shoulder period to conduct pipeline and other maintenance, Nasta said.
“This can result in temporary capacity reductions for production receipts. Thus, while Covid-19 restrictions may disrupt some midstreamers’ maintenance plans, it’s possible we could see some modest and short-term supply disruptions during the spring and early-summer months due to planned or unplanned outages.”
El Paso Natural Gas recently experienced an equipment failure associated with its Cornudas Compressor Station, rendering Unit 1B unavailable. Operational capacity through the “CORN HPW” constraint was to be reduced by 76,600 Dth/d effective Friday (April 3), a reduction that is to remain in effect until further notice.
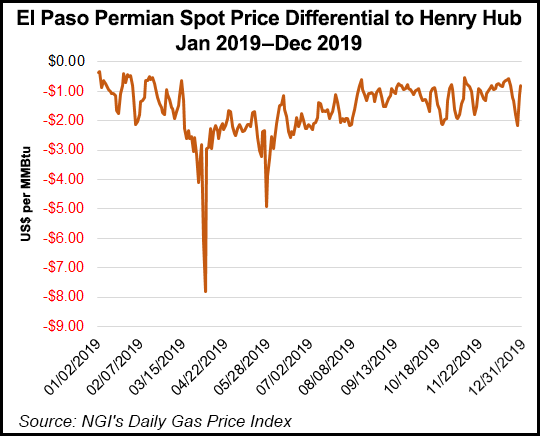
The prospects for lower supply have been a boon for West Texas gas prices. Amid the sea of red across North American forward curves, El Paso Permian stood out from the pack after posting the only gains.
May prices rose 3.0 cents from March 26-April 1 to reach 59.0 cents, while the balance-of-summer strip rose 8.0 cents to $1.11, according to Forward Look. Packages further out the curve were even stronger, with winter 2020-21 jumping 10.0 cents to $1.89 and summer 2021 surging 16.0 cents to $1.81.
Calendar (Cal) year strips also reflected the more optimistic picture for West Texas gas. El Paso Permian’s Cal 2021 strip averaged $1.89, only 60 cents back of Henry Hub. Cal 2022 averaged $1.90, off 51 cents. For comparison, El Paso Permian averaged $1.61 lower than the U.S. benchmark in 2019.
With hues of orange and red showing up on weather maps of the West Coast, the sharp decline in California forward prices is no surprise. Despite brief periods of chilly air expected to move across parts of the region over the next couple of weeks, highs are generally expected to be near perfect in the 70s.
As demand is set to plummet, SoCal Citygate May prices tumbled 17.0 cents from March 26-April 1 to reach $1.657 and the balance of summer dropped 6.0 cents to $2.51, Forward Look data show. Much like the rest of the country, that’s where the losses stopped.
SoCal Citygate’s prompt winter picked up 8.0 cents to reach $3.71, while summer 2021 jumped 14.0 cents to $2.93. Even the Cal 2021 strip posted a double-digit gain, averaging $3.20.
© 2024 Natural Gas Intelligence. All rights reserved.
ISSN © 1532-1231 | ISSN © 2577-9877 |