Markets | LNG | LNG Insight | NGI All News Access | NGI The Weekly Gas Market Report
More Volatility Expected in U.S. Natural Gas Market as LNG Exports Grow
As winter sets in and the U.S. natural gas market braces for the typical volatility that comes with it, growing export and power generation demand could make both benchmark and spot prices even more sensitive in the years ahead, according to industry analysts.
While more natural gas has slowly displaced coal in the nation’s power stack over the last three decades, a meteoric rise in liquefied natural gas (LNG) exports over the last three years has reinforced baseload demand — or the minimum level that must be met on a daily basis across the country, according to RBN Energy LLC.
“The emergence of this seemingly inelastic demand with a baseload-like pull on domestic gas supplies marks an underlying shift in the U.S. gas market that, along with the rising baseload demand from power generation, will make national benchmark Henry Hub prices more prone to spikes,” RBN consultant Katharine Fraser wrote in a recent blog post.
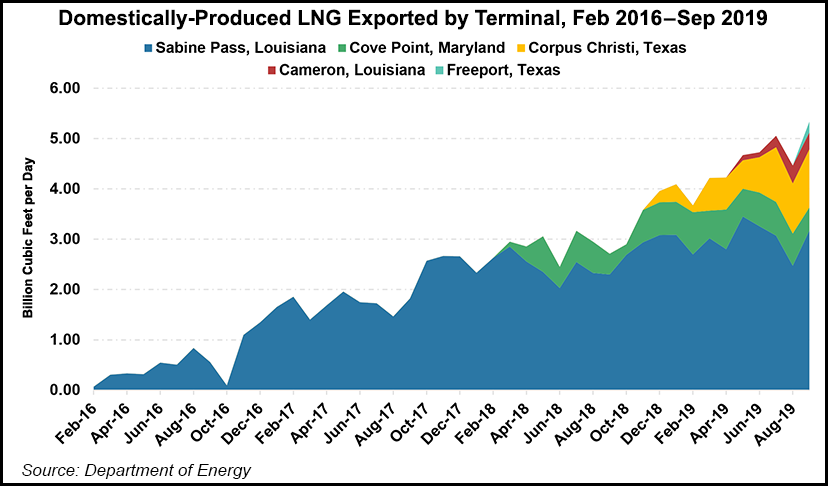
The Energy Information Administration (EIA) recently said it expects U.S. LNG exports to average 4.7 Bcf/d in 2019 and 6.4 Bcf/d in 2020 as new liquefaction projects come online. Feedgas volumes, or those delivered via pipeline to the terminals, are even higher, peaking at more than 7 Bcf/d in the last week, according to NGI’s U.S. LNG Export Tracker, as some of that gas is used to power operations and the rest shrinks during liquefaction.
RBN noted too that overall gas exports, including both LNG and volumes delivered to Mexico via pipeline, have grown from less than 3 Bcf/d in 2015 to more than 10 Bcf/d this year. Increases in exports and gas-fired power generation have strengthened demand and siphoned off more gas that “leaves less wiggle room in the market for gas supply to respond to the incremental demand that comes with extreme weather or other short-term fundamental anomalies.”
LNG terminals, however, will continue to account for the largest share of U.S. exports in the years ahead, as trains scheduled to enter service are expected to push capacity to nearly 12 Bcf/d by 2024, the firm added. Despite a global supply glut, an overwhelming majority of those volumes are practically guaranteed by long-term sales and purchase agreements that require buyers to lift the cargoes, while other market factors make it difficult for offtakers to cancel them on short notice if prices shift.
“U.S. gas market players better get used to the effect of what will eventually be over 10 Bcf/d of exports coming out of the” Gulf Coast and the more than 6 Bcf/d bound for Mexico, said Al Garcia, a partner at Trade Winds Commodity Partners and a former energy trader.
“The effect is still being offset by increasing shale production and by the fact that the U.S. has not reached full liquefaction capacity,” Garcia told NGI. “But the production slope will flatten, and the terminals will be completed. That will present a very different picture” as early as next year.
Dry natural gas production is expected to remain strong through the end of 2019, reaching an average 92.1 Bcf/d for the year, a 10% increase from the 2018 average. However, production growth has been slowing in the United States, according to EIA, and will grow much less in 2020 due to the lag between changes in price and changes in future drilling activity. Domestic production is expected to average 94.9 Bcf/d in 2020.
Increasing baseload demand has already contributed to unprecedented spikes in the physical markets, RBN noted. A headline grabbing move occurred earlier this year during a cold snap at Northwest Sumas, an already volatile trading location at the Canadian border in Washington state that went soaring into the stratosphere. NGI recorded the most expensive individual North American trade on record with Sumas hitting $200 on March 1, or well above a previous record set in January 2018 when Transco Zone 6 NY reached $175.
But upward price movements aren’t the only potential factor on the U.S. side of the LNG equation as exports grow, analysts said.
“The U.S. market currently assumes the demand for LNG will continue to exist and even grow as new terminals are brought online,” Maria Sanchez, manager of strategy and analytics at Enverus, told NGI. “However, Enverus expects most of the impact in gas prices to be negative — lower gas prices — during periods of maintenance or outages at the terminal facilities for example.”
Next year could also beat back U.S. exports as a global supply glut is testing the limits of the market and could find some U.S. terminals shut-in.
Most LNG cargoes out of the Gulf that are tied to a U.S. index are priced off Henry Hub. While terms have been offered at other points, such as Waha, those deals haven’t taken hold. Spot prices could still be impacted by growing LNG exports as competition grows to supply the Gulf Coast, begging the question of how regional pricing will respond to extreme weather, maintenance, shut-ins or other factors going forward.
“We also believe those particular indexes are more impacted by events in Mexico than the Henry Hub, at least on the physical side of the market, so they are more prone to volatility anyway,” said NGI’s Patrick Rau, director of strategy and research, referring to points like Waha and the Houston Ship Channel. “But if LNG cargoes slowed down and feedgas flows into the Gulf Coast plants stalled as a result, that gas would likely back up into East Texas and the Permian, causing basis differentials there to widen.”
© 2024 Natural Gas Intelligence. All rights reserved.
ISSN © 1532-1231 | ISSN © 2577-9877 | ISSN © 1532-1266 |