E&P | NGI All News Access | NGI The Weekly Gas Market Report
Rigs Keep Dropping Out of U.S. Patch as Oil, Gas Both Down
Another week, another round of losses for the U.S. onshore, according to the latest data from Baker Hughes, a GE Company (BHGE); the domestic drilling count fell five rigs to sit at 855 as of Friday.
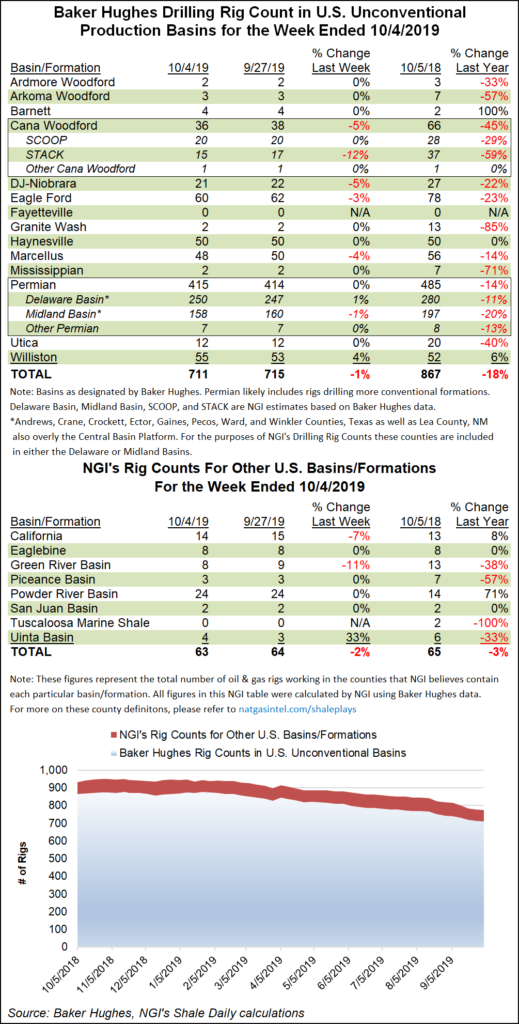
The losses included three oil-directed rigs and two natural gas-directed. The U.S. rig count, in a steady decline since April, now lags its year-ago total by nearly 200 units, BHGE data show.
For the week ended Friday, all five units to exit the domestic patch were on land, with the Gulf of Mexico maintaining 22 rigs. The losses included three directional units and three horizontal units, partially offset by the addition of one vertical unit.
Meanwhile, Canada’s rig count increased for a second straight week, picking up 17 rigs — all oil-directed — to reach 144, versus 182 a year ago. The combined North American count rose 12 units week/week to 999, down from 1,234 in the year-ago period.
Among major plays, the Marcellus Shale, Cana Woodford and Eagle Ford Shale each dropped two rigs from their respective totals, while the Denver Julesburg-Niobrara dropped one. The Williston Basin, up two units week/week, and the Permian Basin, up one, each added rigs.
While the total Permian Basin count remained steady for the week, there was some shuffling around among the states that underlie the play. New Mexico gained four rigs week/week to reach 113 (up from 99 a year ago), while Texas saw four rigs depart, dropping the Lone Star State to 414 (524 a year ago).
Also among states, Oklahoma dropped three rigs for the week, while West Virginia dropped two. California, Colorado, Louisiana and Wyoming each dropped one rig, while Alaska, North Dakota and Utah each added one, according to BHGE.
While the oil rig count has fallen dramatically in the U.S. onshore over the past year, domestic oil exports have climbed to record levels. The Energy Information Administration (EIA) said U.S. oil exports this year through June averaged 2.9 million b/d, up 966,000 b/d from the first half of 2018. What’s more, exports set a record high monthly average at 3.2 million b/d for June, according to the agency.
Canada remained the top destination for U.S. exports, but volumes exported to the country changed little in the first half of 2018 or 2019. By contrast, U.S. crude exports to most other major destinations climbed.
The top regional destination from January through June was the Asia-Oceania region at 1.3 million b/d, with exports to these countries collectively increasing year/year by 472,000 b/d (58%).
© 2024 Natural Gas Intelligence. All rights reserved.
ISSN © 2577-9877 | ISSN © 1532-1266 | ISSN © 2158-8023 |