NGI The Weekly Gas Market Report
Markets | Forward Look | NGI All News Access
Market Weakness Grips Natural Gas Forwards; Maintenance Wreaks Havoc in Northeast
After showing some signs of weakness the previous week, natural gas forwards buckled during the Sept. 20-25 time period as demand was seen waning even further in the weeks ahead, while plump production and other seasonal factors weighed on the markets.
October prices dropped an average 8 cents, while the winter 2019-2020 strip fell 4 cents and the summer 2020 slipped a couple of pennies, according to NGI’s Forward Look.
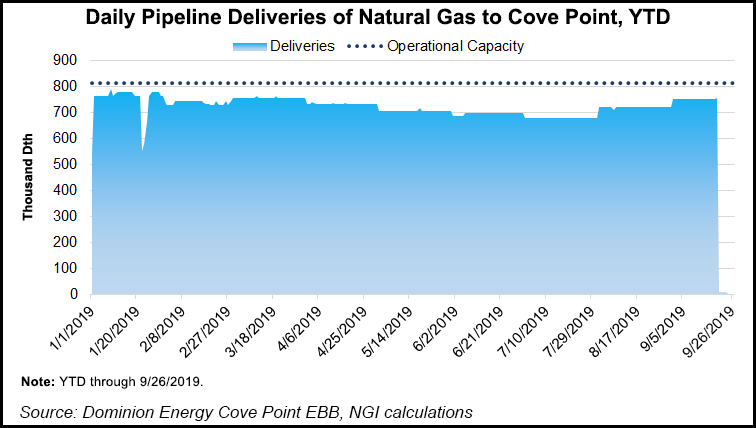
Technical trading continued to dominate the Nymex futures market, but other factors came into play for several other market hubs. Steep losses were seen for October prices in the Northeast and Appalachia as the scheduled maintenance at Dominion Energy’s Cove Point liquefied natural gas (LNG) export terminal coincided with milder weather. The one-two punch sent October plummeting as much as a quarter during the Sept. 20-25 period. However, a major pipeline maintenance already underway sent winter prices screaming higher.
Futures action was more subdued, however, as traders struggled to send prices definitively lower due to lingering heat in some key demand regions. Thursday’s weather data was “a little more complicated” due to some large overnight model changes, mostly in the American ensemble data, which favored a colder turn in the 11- to 15-day forecast across the Midwest and Northeast, according to Bespoke Weather Services. The midday run of the American model didn’t back off its projected demand, and in fact added another degree day to its outlook.
The early European model added some demand as well, but showed a much less threatening pattern as far as any notable chill, Bespoke said. The firm favored the European data as it did not see signals in the overall pattern that would suggest a turn colder.
“This, of course, does not preclude some variability, but when all is said and done, we continue to favor the continuation of the warmer-than-normal base state, and what should generally tend to be a below-normal demand regime going forward,” Bespoke chief meteorologist Brian Lovern said.
Near-record production and weaker demand from LNG export facilities also gave bears plenty to sink their teeth into. In addition to the planned maintenance at Cove Point that had deliveries to the East Coast facility holding at zero, capacity utilization rates at the Elba Island, Freeport and Cameron export terminals all remained below 25% as well, NGI’s LNG Tracker data show.
With fall temperatures becoming more widespread in the coming weeks, the overall supply/demand balance is expected to loosen even more. However, some recent trading patterns shed light on the manner in which the market may cope with the oversupply.
During the Sept. 21-22 weekend, Tropical Storm Imelda’s crushing impact on demand, reduced LNG feed gas demand due to the Cove Point shut-in and excess year/year nuclear generation created some “jarring changes” in Appalachian producing markets, the Perryville hub and even in Upper Midwest demand markets, according to Mobius Risk Group.
For example, Dominion South plunged to a discount of more than $1.40 to Henry Hub on Sept. 20, after having averaged just 40 cents below the benchmark since the beginning of June, NGI data show. Locations considered relevant to Perryville pricing were more than 40 cents behind Henry, and Upper Midwest market areas fell approximately 60 cents behind.
“From our viewpoint, this illustrates what pricing mechanisms will be utilized to manage temporary ”oversupply’ this fall,” Houston-based Mobius said.
Looking ahead, Cove Point is expected to return to full capacity again before the middle of October, while seasonal nuclear outages will reduce the year/year surplus in generation. Meanwhile, temperatures will gradually begin to cool in the northern tier of the country.
“This later factor will be the fulcrum from which the market will move over the next couple of weeks,” Mobius said.
The cooler shift is already showing up in DTN’s long-term weather outlook, which transitions to a “decidedly more bullish” outlook as warm anomalies across the southern United States bolster late-season cooling demand and cold anomalies seep across the northern tier to support early-season heating demand. The outlook calls for 52 gas-heating degree days (GHDD), just 5 GHDDs below 30-year normals, and 13 cooling degree days, resulting in a week/week uptick in weather-driven demand of 0.3 Bcf/d.
The shifting forecast appears to head off very bearish concerns that record September heat would carry forward into October and destroy early-season heating demand, according to EBW Analytics Group. Furthermore, concerns about the Madden-Julian oscillation highlight a small risk that temperatures may flip colder by late October, potentially sparking an autumn increase in Nymex futures similar to what was seen last year.
In 2018, a “tremendously loose supply/demand balance” allowed the market to enter the winter with 3,247 Bcf in peak mid-November 2018 storage, according to the Energy Information Administration (EIA). Although the November chill and subsequent run-up in pricing proved that this was too low for market comfort, this year’s storage trajectory indicates that stocks could have an additional 500 Bcf in storage this November, according to EBW.
The improved storage situation, combined with a continuing loose supply/demand balance, “suggests that market softening remains the most-likely scenario,” the firm said.
Indeed, the EIA data, and the market’s reaction to it, will be of significant importance as the traditional injection season winds down. On Thursday, the EIA reported a monstrous 102 Bcf injection into storage inventories for the week ending Sept. 20. The reported build came in around 10 Bcf higher than estimates and was exactly double the 51 Bcf build recorded in the year-ago period. It also easily topped the 74 Bcf five-year average.
Genscape Inc. senior natural gas analyst Eric Fell attributed the hugely bearish miss to production growth and weaker industrial demand, both of which fall under the extremely opaque South Central region.
“Most industrial demand is hidden. Most of the production growth is behind intrastate systems as well and very hard to track,” Fell said on Enelyst, a social media chat room hosted by The Desk.
NGI market analyst Nathan Harrison agreed that the South Central region is especially hard to model, with both exports to Mexico and LNG playing a role. “The lack of transparency on intrastate pipelines makes things more difficult from an analyst perspective and of course, this is especially true in Texas where so many of the pipelines are intrastates.”
Broken down by region, the South Central reported a net 24 Bcf injection, including a 16 Bcf build in nonsalt facilities and a 7 Bcf build in salts, according to EIA. The Midwest added 36 Bcf to stocks, while the East added 31 Bcf. The Pacific region injected 7 Bcf, and Mountain inventories grew by 6 Bcf.
Total working gas in storage rose to 3,205 Bcf, 444 Bcf above last year and just 47 Bcf below the five-year average, EIA said.
Nymex futures traders responded swiftly to the government data. The expiring October contract was hovering around $2.470-2.490 just ahead of the report, but the minute the surprise injection crossed trading screens, the front month dropped to as low as $2.408. October eventually rolled off the board at $2.428, down 7.4 cents on the day. November dropped 7.5 cents to $2.443.
Enelyst managing director Het Shah expects prices to remain in this range until next week’s EIA report. “If it confirms the production growth story, then we see another step down…otherwise, we bounce in the $2.40-2.50 range.”
Not even the long-anticipated in-service of Kinder Morgan Inc.’s Gulf Coast Express was enough to prevent the floor from opening up across West Texas forward markets.
Prices were lower at the front of the curve, but losses were in line with those in the Nymex futures curve and at most other pricing hubs across the United States. However, far more substantial declines were seen in the November contract through next summer, according to Forward Look.
Waha October dropped 7 cents from Sept. 20-25 to reach $1.684, a little more than 80 cents below Henry Hub. November was down a much sharper 22 cents to $1.645, while the winter strip was down 19 cents to $1.73, some 93 cents below Henry. Next summer, the Waha-Henry Hub spread blows out to $1.47 as Waha averaged just 91 cents as of Sept. 25.
The wider spread seen next summer is not all that surprising. GCX is expected to fill quickly as record flaring and robust production growth are expected to unleash pent-up Permian Basin associated gas into the market.
Analysts at Tudor, Pickering, Holt & Co. (TPH) are modeling 1.2 Bcf/d of initial flows on GCX, with the line reaching capacity by 2Q2020. The rate at which the pipeline fills its capacity could have “significant impacts on natural gas inventories” through the fall and winter.
“TPH’s estimated 2.0 Bcf/d of annual residue gas growth neatly matches additional takeaway capacity, lending itself to a status quo outlook,” analysts said. “The market will need to see progress on additional capacity late 2021/early 2022 to underwrite a more structural improvement in basin takeaway dynamics.”
While Kinder Morgan is basking in bringing GCX online slightly ahead of schedule, Cheniere Energy Inc. appears well behind schedule for its Midship Pipeline. The 1.1 Bcf/d pipeline, designed to transport gas from the Anadarko Basin to the Gulf Coast, is not close to reaching the targeted Oct. 1 in-service date, according to Genscape.
Heavy rains and flooding throughout the summer have slowed construction, eventually causing a month-long stop work order for about 50 miles of the mainline, the data firm said. As of Aug. 30, the mainline is roughly 64% complete, and overall, Cheniere estimates the mainline/laterals to be around 60% complete.
“Though the southern spread was progressing at well around 83% complete, the project cannot flow without the northern spread, which was only about 45% complete at the end of the reporting period,” Genscape natural gas analyst Laura Munder said. “With the continuing weather issues and increasing landowner disputes, Genscape has not moved our estimated in-service date from December 2019 with a medium-high risk for additional delay.”
Cheniere has struggled to fully subscribe the Midship project and eventually reduced the capacity from its originally proposed 1.44 Bcf/d design capacity to 1.1 Bcf/d, which was carried out by removing one turbine from each of the three compressor stations.
“We are expecting the project to reroute nearly all of the gas from existing pipes when it enters service,” Munder said.
Prices in the region remain some of the softest in the country as Permian supplies have essentially backed up gas in other producing regions. OGT October prices slipped 2 cents from Sept. 20-25 to reach $1.624, nearly 90 cents below Henry Hub. November fell 8 cents to $1.632, the winter dropped a dime to $2.02 and the summer slipped 2 cents to $1.80, Forward Look data show.
Over in the Northeast, 20-cent declines were the norm at the front of the curve as weak demand from generally mild weather weighed heavily on markets. However, seasonal maintenance influenced prices for the winter, with basis tightening since a major pipeline in the region provided an update to its maintenance plans.
Texas Eastern on Aug. 29 began a series of maintenance events that enacted flow restrictions along the Penn-Jersey Line, the northern leg of M3, beginning at the Delmont, PA, compressor station (CS) and ending at the Linden, NJ, CS.
Several curtailments were outlined along the Texas Eastern system for the remainder of summer and into the winter, which are expected to significantly constrain the M-3 market area, according to Genscape.
Forward prices responded immediately to the pipeline announcement, with Texas Eastern M3 basis prices for December through March 2020 climbing almost immediately, and gaining nearly 50 cents at its peak, Forward Look data show.
As of Wednesday, the Texas Eastern M-3 winter strip sat at $4.22, a $1.56 premium over Henry Hub. Last winter, the Appalachian pricing hub averaged just about 20 cents higher than the benchmark.
The biggest capacity restriction is at the start of M3 at Delmont, where winter capacity will be reduced to 2.16 Bcf/d. Flows through the Penn-Jersey Line far surpass that level in the winter, with last winter’s peak flows reaching 2.93 Bcf/d on February 1, meaning a max curtailment of around 770 MMcf/d, according to Genscape.
The curtailments get somewhat milder farther downstream, with maximum flow restrictions reaching 490 MMcf/d at Perulack compared to last winter’s peak flows, the firm said. Other restrictions, though not as extreme as those at Delmont, are seen providing bullish pressure for the constrained Algonquin Gas Transmission system.
Indeed, Algonquin Citygates October prices dropped 7 cents from Sept. 20-25, but November jumped 13 cents to $3.607. The full winter strip was up just 6 cents, but averaged $6.67, a whopping $4.00 over Henry Hub.
© 2024 Natural Gas Intelligence. All rights reserved.
ISSN © 2577-9915 | ISSN © 2577-9877 | ISSN © 1532-1266 |