Utica Shale | E&P | Eagle Ford Shale | Haynesville Shale | Marcellus | NGI All News Access | Permian Basin
U.S. Oil, Natural Gas Revolution ‘Alive and Kicking,’ Says BP’s Chief Economist
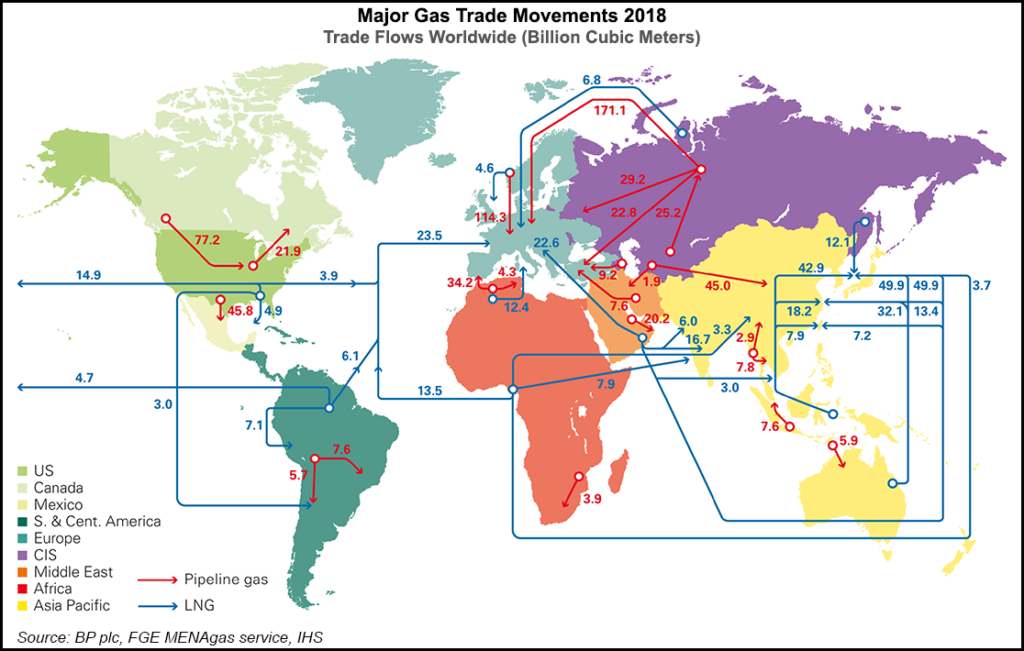
Energized by over-the-top results in the Lower 48, U.S. oil and gas consumption and production growth accelerated in 2018 at a record pace, solidifying the country as the world’s largest producer, BP plc said in its latest statistical overview.
The supermajor’s touted benchmark report, the 68th annual Statistical Review of World Energy, compared year/year data for 2018 from 2017. Chief economist Spencer Dale held court during a press conference to unveil the findings.
The growth rates for U.S. oil and gas output last year “exceeded any other country’s annual increase in our 50-year history,” Dale said.
Last year proved to be a “bonanza year” for natural gas, “with both global consumption and production increasing by over 5%, one of the strongest growth rates in either gas demand or output for over 30 years. The main actor here was the U.S., accounting for almost 40% of global demand growth and over 45% of the increase in production.”
Domestic gas production increased by 86 billion cubic meters (bcm), up almost 12% year/year, driven by unconventional output from the Haynesville and Marcellus shales, along with the Permian Basin.
“Indeed, the U.S. achieved a unique double first last year, recording the single largest-ever annual increases by any country in both oil and gas production,” Dale noted. “In case there was any doubt, the U.S. shale revolution is alive and kicking.”
Some of the increase in U.S. gas supply was used to feed three new liquefied natural gas trains that came onstream last year, but “the majority was used to quench the thirst of domestic demand,” he noted. Gas consumption in the United States increased by 78 bcm last year, roughly the same growth achieved over the previous six years.
Last year proved to be another “rollercoaster year for oil markets, with prices starting the year on a steady upward trend, reaching the dizzying heights of $85/bbl in October, before plunging in the final quarter to end the year at close to $50/bbl,” Dale said. Demand for oil worldwide was relatively stable, increasing by 1.4 million b/d last year.
“In an absolute sense, the growth in demand was dominated by the developing world, with China (0.7 million b/d]) and India (0.3 million b/d) accounting for almost two-thirds of the global increase.
“But relative to the past 10 years or so, the big outlier was the U.S., where oil demand grew by 0.5 million b/d in 2018, its largest increase for well over 10 years, boosted by increased demand for ethane as new production capacity came onstream.”
Increasing demand for petrochemicals drove oil demand in part, with products most closely tied to the sector — ethane, liquefied petroleum gas and naphtha — accounting for around one-half of the overall demand growth in 2018.
“Against this backdrop of steady demand growth, all the excitement came from the supply side, where global production grew by a whopping 2.2 million b/d, more than double its historical average,” said Dale.
No surprise that the majority of the growth was in the United States, up 2.2 million b/d, “the largest ever annual increase by a single country,” Dale noted.
“Since 2012 and the onset of the tight oil revolution, U.S. production, including natural gas liquids, has increased by over 7 million b/d,” which is “broadly equivalent to Saudi Arabia’s crude oil exports, an astonishing increase which has transformed both the structure of the U.S. economy and global oil market dynamics.
“Largely as a consequence, U.S. net oil imports shrunk to less than 3 million nb/d last year, compared with over 12 million b/d in 2005.”
In a separate report issued Wednesday by Rystad Energy, the United States is estimated to have 293 billion bbl in recoverable oil resources.
“This is 20 billion bbl more than Saudi Arabia and almost 100 billion bbl more than Russia,” according to Rystad. The recoverable domestic oil also is “five times more than officially reported proven reserves as published in the BP Statistical Review of World Energy 2019.”
Tight oil plays in the Permian are estimated to hold 100 billion bbl of recoverable oil resources, “largely flat from the previous year, as production has been replaced through improvements in well configuration, largely driven by supermajors increasing their footprint” in the Midland sub-basin and by fine-tuning operations.
“We also note that production has not been fully replaced by increased reserves in some U.S. shale plays, including Eagle Ford in Texas and Utica in Ohio,” Rystad CEO Jarand Rystad said. “Oil companies have been focusing on core development and cash flows rather than exploration and de-risking noncore assets.”
© 2024 Natural Gas Intelligence. All rights reserved.
ISSN © 2577-9877 | ISSN © 2158-8023 |