NGI The Weekly Gas Market Report | E&P | LNG | NGI All News Access
U.S. Clobbering Every Country in Natural Gas, Oil Production, Says BP’s Benchmark Review
The United States last year exceeded every other country in the world with the largest-ever annual production increases for natural gas and for oil, with most of the gains from the Lower 48, according to BP plc.
The supermajor’s touted benchmark report, the 68th annual Statistical Review of World Energy, compared year/year data for 2018 from 2017. Economists determined that global energy demand overall increased by 2.9% year/year, while carbon emissions climbed by 2%, faster than at any time since 2010-2011.
Chief economist Spencer Dale, who held court during a press conference to unveil the findings, noted that global liquefied natural gas (LNG) supply continued a “rapid expansion last year, increasing by almost 10%,” or 37 billion cubic meters (bcm), as new liquefaction plants in Australia, the United States and Russia were either started or ramped up.
“For much of the year, the strength of Asian gas demand, led by China, was sufficient to absorb these increasing supplies,” Dale said. “But a waning in the strength of Asian demand toward the end of the year, combined with a mini-surge in LNG exports, caused prices to fall back and the differential between Asian and European spot prices to narrow significantly.”
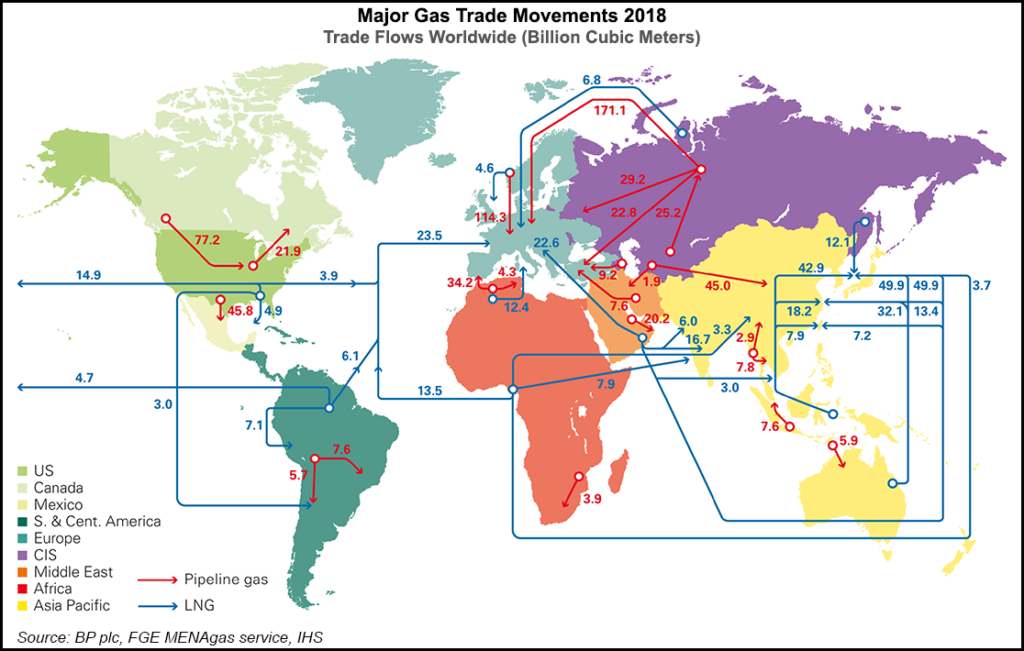
Last year overall proved to be a “bonanza year” for natural gas, said Dale, “with both global consumption and production increasing by over 5%, one of the strongest growth rates in either gas demand or output for over 30 years.
“The main actor here was the U.S., accounting for almost 40% of global demand growth and over 45% of the increase in production.”
Domestic gas production increased by 86 bcm, up almost 12% year/year, driven by Lower 48 unconventional output from the Haynesville and Marcellus shales, along with the Permian Basin.
“Indeed, the U.S. achieved a unique double first last year, recording the single largest-ever annual increases by any country in both oil and gas production,” Dale noted. “In case there was any doubt, the U.S. shale revolution is alive and kicking.”
Global gas production increases were supported by Russia (34 bcm), Iran (19 bcm) and Australia (17 bcm).
Some of the increase in U.S. gas supply was used to feed three new LNG trains that came onstream last year, but “the majority was used to quench the thirst of domestic demand,” Dale noted.
Gas consumption in the United States increased by 78 bcm last year, roughly the same growth achieved over the previous six years.
“This exceptional strength appears to be largely driven by the same weather-related effects, with rising demand for space heating and cooling fuelling increased gas consumption, both directly, and, more importantly, indirectly via growing power demand,” he said.
“The expansion of gas consumption within the U.S. power sector was further boosted by almost 15 GW of coal-fired generation capacity being retired last year.”
Beyond the United States, gas demand growth was concentrated across China (43 bcm), Russia (23 bcm) and Iran (16 bcm), “which together with the U.S. accounted for 80% of global growth,” said the chief economist.
“China gas consumption grew by an astonishing 18% last year. This strength stemmed largely from a continuation of environmental policies encouraging coal-to-gas switching in industry and buildings in order to improve local air quality, together with robust growth in industrial activity during the first half of the year.
“Asian prices have fallen in the first part of this year toward the bottom of the price band defined by U.S. exporters’ full-cycle and operating costs,” Dale told the audience.
“The prospect of further rapid increases in LNG supplies this year means there is a possibility of a first meaningful curtailment of some LNG supply capacity. The extent of any eventual shut-in will depend importantly on the European market, which acts as the de facto ”market of last resort’ for LNG supplies.”
Last year Europe’s gas demand contracted by slightly more than 2% (11 bcm), “but this fall in demand was more than matched (minus 13 bcm) by continuing declines in Europe’s aging gas fields. The small increase in European gas imports was largely met by LNG cargoes diverted from Asia toward the end of the year as the Asian premium over European prices almost disappeared.”
Meanwhile, Russian gas pipeline exports to Europe remained flat from 2017, maintaining the record levels built up in recent years, with a slight decline in their share of Europe’s gas imports.
“A key factor determining the role that Europe will play in balancing the global LNG market over the coming years will be the extent to which Russia seeks to maintain its market share,” Dale said.
Last year proved to be another “rollercoaster year for oil markets, with prices starting the year on a steady upward trend, reaching the dizzying heights of $85/bbl in October, before plunging in the final quarter to end the year at close to $50/bbl,” Dale said.
Demand for oil worldwide was relatively stable, increasing by 1.4 million b/d last year.
“In an absolute sense, the growth in demand was dominated by the developing world, with China (0.7 million b/d]) and India (0.3 million b/d) accounting for almost two-thirds of the global increase.
“But relative to the past 10 years or so, the big outlier was the U.S., where oil demand grew by 0.5 million b/d in 2018, its largest increase for well over 10 years, boosted by increased demand for ethane as new production capacity came onstream.”
Increasing demand for petrochemicals drove oil demand in part, with products most closely tied to the sector — ethane, liquefied petroleum gas and naphtha — accounting for around one-half of the overall demand growth in 2018.
“Against this backdrop of steady demand growth, all the excitement came from the supply side, where global production grew by a whopping 2.2 million b/d, more than double its historical average,” said Dale.
No surprise that the majority of the growth was in the United States, up 2.2 million b/d, “the largest ever annual increase by a single country,” he noted.
“Since 2012 and the onset of the tight oil revolution, U.S. production, including natural gas liquids, has increased by over 7 million b/d,” which is “broadly equivalent to Saudi Arabia’s crude oil exports, an astonishing increase which has transformed both the structure of the U.S. economy and global oil market dynamics.
“Largely as a consequence, U.S. net oil imports shrunk to less than 3 million nb/d last year, compared with over 12 million b/d in 2005.”
Global power demand grew by 3.7% year/year, one of the strongest growth rates in 20 years, absorbing around one-half of the growth in primary energy, according to the analysis. The developing world drove most of the growth at 81%, led by China and India.
“But the particularly strong growth of power demand in 2018 owed much to the U.S., where power demand grew by a bumper 3.7%, boosted by those weather effects,” Dale said.
The growth in power generation supply was led by renewable energy, up 14.5%, contributing around one-third of the growth, followed by natural gas (3.9%) and coal (3%).
© 2024 Natural Gas Intelligence. All rights reserved.
ISSN © 1532-1231 | ISSN © 2577-9877 | ISSN © 1532-1266 |