NGI The Weekly Gas Market Report
Markets | Forward Look | NGI All News Access
Shift to Spring-like Weather Ends Month-long Natural Gas Forwards Rally
After a month of weekly gains, natural gas forward prices slammed the brakes as the latest weather models indicate the end of winter is fast approaching. April forward prices fell an average 7 cents from March 7-13, while May and the summer strip (April-October) each fell less than a nickel, according to NGI’s Forward Look.
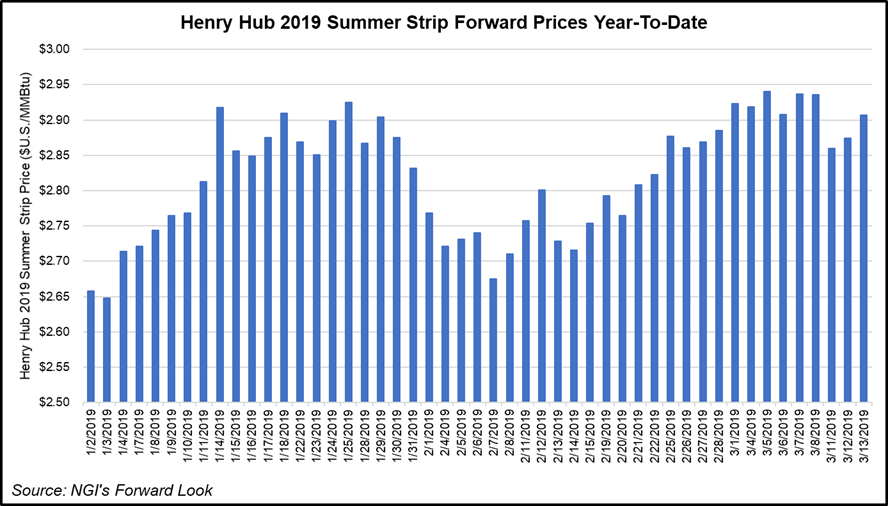
The losses closely tracked those seen along the Nymex futures curve, which shifted very little ahead of the weekend but then plunged nearly a dime to start the week as weather models shifted significantly warmer for the long range. After plunging roughly 9 cents on Monday, a modest recovery sent the Nymex April contract ultimately around 4 cents lower for the four-day time period to $2.82, while May fell around 3 cents to $2.834 and the summer strip lost about a penny to hit $2.901.
While weather sentiment has generally shifted more bearish, individual datasets have remained volatile as warmer changes have been seen in overnight weather model cycles, only to be followed by colder changes in the afternoon, according to Bespoke Weather Services. Wednesday night’s model runs continued this trend, going a little warmer after the colder changes in the afternoon.
“Big picture wise, not much has changed, however, with a variable pattern, biased to the warmer side of normal toward the final third of the month,” Bespoke chief meteorologist Jacob Meisel said.
With the El Niño base state still in control of the global pattern, the firm feels that there will continue to be storminess and variability in the pattern from late March into early April, with a lean toward the warmer side of normal in terms of national gas-weighted degree days. While not deviating strongly from normal, this would still deliver a much different demand picture versus last year, when high-end cold took hold from late March throughout the entire month of April, the firm said.
Meanwhile, the National Oceanic and Atmospheric Administration’s Climate Prediction Center said the El Niño will probably last until June, and that there is a roughly 60% chance the weather pattern will last until September and a roughly 50% chance it will linger longer. Forecasters noted, however, that El Niño projections from March to May “tend to be less accurate.”
The rapid drop in demand reflected in the latest weather outlooks has occurred as production has shown signs of rebounding from earlier lows. Pipeline flow monitors suggest output this week will climb 0.4 Bcf/d versus last week, according to EBW Analytics. Still, March-to-date production remains 0.3-0.5 Bcf/d below December levels, suggesting further increases are likely in the weeks ahead as production continues to rebound post winter.
The double whammy of softening demand and rising production highlights the projected loosening in the year/year storage comparison, with the potential for a 450 Bcf bearish swing over the next eight weeks.
“Over this time, a structurally looser market is expected to pick up a tailwind from bearish weather comparisons, prompting the deficit to fall by as much as 7.8 Bcf/d over the next two months,” EBW CEO Andy Weissman said.
On Thursday, the Energy Information Administration (EIA) reported that storage inventories dropped by 204 Bcf for the week ending March 8. The draw was on the low end of a wide range of expectations and fell about 5 Bcf shy of consensus.
Major surveys had pointed to a withdrawal in the 208-210 Bcf range, and some estimates approached 220 Bcf. Intercontinental Exchange EIA financial weekly index futures had settled on a pull of 205 Bcf, while NGI’s model had predicted a 222 Bcf withdrawal.
The reported draw, however, was bullish compared to the five-year average 99 Bcf withdrawal and last year’s 88 Bcf pull.
Bespoke, which had pegged the draw at 209 Bcf, said the weekly storage data continues to be noisy, as last week’s draw was 6 Bcf larger than its expectation while this week’s was 5 Bcf smaller, “indicating we continue to have a strong read of balance on a two-week rolling basis.
“Though the number was slightly bearish to the market consensus, we saw risk to the bearish side and still saw a very significant salt draw that can keep a bid under day ahead cash,” Meisel said.
This keeps the firm from seeing the number as all that bearish, although following the significant cold last week, it expects to see significant loosening in future numbers as the storage looks to just barely dip below 1.1 Tcf.
“The market has been bid up on worries of stagnant production and a large draw, and now one of those worries can be put behind us,” Meisel said.
Total working gas in underground storage as of March 8 stood at 1,186 Bcf, 359 Bcf (23.2%) below year-ago inventories and 569 Bcf (32.4%) below the five-year average, according to the EIA.
By region, EIA reported a 51 Bcf withdrawal in the Midwest, with the East pulling 49 Bcf from stockpiles. The Pacific saw a 10 Bcf pull for the week, while 7 Bcf was withdrawn in the Mountain region. The South Central saw 88 Bcf pulled from stocks, including 51 Bcf from salt and 37 Bcf from nonsalt, according to EIA.
Meanwhile, early estimates for next week’s EIA report point to a much smaller storage withdrawal in the 51 to 71 Bcf range, which would compare to last year’s 87 Bcf pull for the similar week and the five-year average of 56 Bcf.
Looking ahead to the spring refill season, Societe Generale analysts said that while the storage deficit to last year at the end of winter will be less than what it was at the start, the storage situation is much weaker headed into this injection season than was expected. The firm’s end-of-October storage expectation is now 3.5 Tcf, which would create the second lowest storage start for a winter in its history set, behind only last year.
“We feel the current storage trajectory increases upside price risk on core summer 2019 and winter 2019-20 contracts,” analyst Breanne Dougherty said.
A hot summer could easily support much stronger power generation levels than assumed in the firm’s base case, and put storage on a trajectory comparable to the low last year. Under this scenario, Societe Generale expects core summer prices in the $3.10-3.30 range, but perhaps most importantly, it highlights risk of $3.50-plus prices in winter 2019-20.
The biggest downside price risk to the firm’s 12-month forecast is weaker liquefied natural gas exports, which would allow for a faster injection pace this summer than assumed in its base-case balances.
“We see the global gas market moving into a period of oversupply, and with the United States playing the role of marginal supplier, there is risk for reduced utilization of U.S. export facilities,” Dougherty said.
The firm assumes an average 90% utilization of LNG export facilities through 2020. If utilization falls to average even 75%, it would expect 2H19 prices to average about 10 cents lower, but it would expect 2020 prices to average closer to current 2Q2019-4Q2020 market expectation, at $2.65. “We see a 30% chance that U.S. export utilization averages lower than our assumption,” Dougherty said.
Permian Prices Sink Further
While market hubs across the country ended the week in the red, the pricing picture was even more bleak in the Permian Basin, where prompt-month contracts fell further below the $1 threshold, according to Forward Look.
Waha April prices fell 9 cents from March 7-13 to reach just 67 cents, while May slipped a penny to 88 cents and the summer strip dropped 9 cents to $1.19. Unlike cash prices, which have seen a substantial bounce this week, forward prices remain far back of Henry Hub, coming in more than $2 below the benchmark for April, $1.95 below for May and nearly 60 cents below for the summer.
El Paso Permian forward prices were slightly stronger than Waha during the March 7-13 period, but also remained well below Henry Hub.
In contrast, West Texas cash prices continued to strengthen Wednesday, building on a run of day/day gains that has seen the constrained producing region close the gap on Henry Hub this week. Waha gained 41.5 cents to average $1.670. Since Friday, when Waha traded $2.175 back of Henry Hub, basis at the West Texas trading point has improved by around $1 to average minus $1.140 Wednesday, NGI data show.
The weakness in the nearby months of the forward curve reflect the ongoing pipeline constraints in the Permian. While some new infrastructure is slated to come online in October, as evidenced in the stronger pricing in the back end of 2019, the majority of the constraints are not expected to be relieved until 2020.
Still, that’s not stopping robust production growth in the region, where gas is produced as a byproduct with drilling activity concentrated on oil. Just last week, ExxonMobil Corp., one of the most active drillers in the Permian, said it plans to boost production in the basin to more than 1 million boe/d by as early as 2024, an increase of nearly 80%.
Meanwhile, Evercore ISI reported that during February, Permian Basin permitting remained strong, with activity in West Texas and southeastern New Mexico collectively up 101 month/month to 804. Drilling activity, however, trended down across the basin in February, as horizontal rigs fell to 425, off nine month/month. Operators also dropped three nonhorizontal rigs to end at 43.
Elsewhere across the country, New England forward prices posted far more substantial losses than most other market hubs as a shift to more spring-like temperatures has taken place in the region. Algonquin Citygates April plunged 21 cents from March 7 to 13 to reach $3.184, while May dropped a more modest 6 cents to $2.714 and the summer fell a nickel to $2.95, according to Forward Look.
In the Rockies, Northwest Sumas continued to see substantial swings at the front of the curve in response to volatility in the cash market. Cash prices averaged $10 on Friday, fell to $3.47 by Tuesday and then bounced back to $4.265 by Wednesday. Still, that’s a far cry from the $200 level seen earlier this month.
On the forward curve, Northwest Sumas April tumbled 46 cents to $3.11, while May held steady at $2.535 and the summer held at $2.97, Forward Look shows.
© 2024 Natural Gas Intelligence. All rights reserved.
ISSN © 2577-9915 | ISSN © 2577-9877 | ISSN © 1532-1266 |