NGI The Weekly Gas Market Report | Markets | NGI All News Access
Top North American Natural Gas Marketers Rack Up Fourth Straight Increase in 3Q2018 NGI Survey
Twenty-five leading natural gas marketers added another 8.04 Bcf/d (7%) to their total sales volumes in 3Q2018 compared with the same period last year, a fourth consecutive quarter with a significant upward trend, according to NGI‘s 3Q2018 Top North American Natural Gas Marketers rankings.
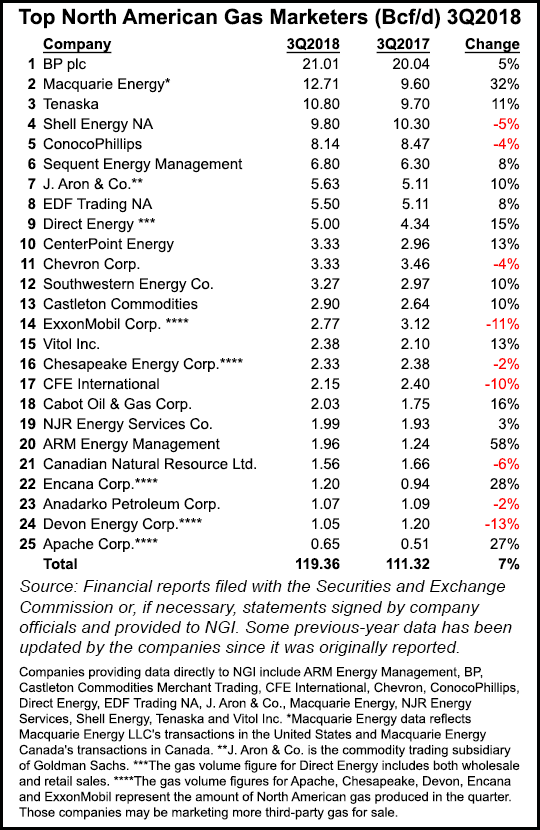
Participating gas marketers reported combined sales transactions of 119.36 Bcf/d in 3Q2018, a 7% increase compared with 111.32 Bcf/d in 3Q2017. The 3Q2018 increase follows a 9% surge in sales of natural gas reported by marketers in 2Q2018 compared with 2Q2017, an 8% increase in 1Q2018 compared with 1Q2017, and a 7% increase in 4Q2017 compared with 4Q2016.
Eight of the survey’s top 10 marketers, including the top three, and 16 companies overall reported higher numbers in 3Q2018 than in the year-ago period.
“U.S. marketed volumes are up because there is simply more gas to market,” said NGI’s Patrick Rau, director of Strategy & Research. “2018 dry gas production through August averaged 81.2 Bcf/d, up 10.9% from the 73.2 Bcf/d through the first eight months of 2017. That is a significant increase.”
If that 10.9% year/year increase holds for the entire year, 2018 would be the highest growth production year in the new millennium, besting the 7.4% increase achieved in 2011, according to NGI calculations based on Energy Information Administration (EIA) data.
Production should continue to climb through the end of the year, especially with the Atlantic Sunrise expansion in service since early October, and several other pipeline projects about to enter service in the Appalachia, Rau said.
However, with Permian prices occasionally dropping below zero in recent days, he expects the torrid pace of production growth in the Permian Basin to slow in the months ahead.
“Yes, that’s almost all associated gas, and yes, you have to figure that certain producers would be happy to pay folks to take that gas, if it means they can keep their oil flowing. But the reason prices have become negative there is simply almost nowhere for incremental production to flow,” he said.
One thing that could also support 4Q2018 volumes is the increase in volatility, especially now the calendar has turned to winter. “We’ve seen winter volatility in recent years, but not really this much this early. Marketing companies should see an uptick in volumes from that, everything else being equal,” Rau said.
The first official day of winter is still weeks away and forecasters are expecting a warmer-than-average season. However, cold weather is already gripping portions of the United States, and prolonged periods of cold temperatures could still trigger regional pipeline constraints in New York City, Boston and Los Angeles and increase the risk of price volatility, according to the FERC’s 2018-2019 Winter Energy Market Assessment. Surging Lower 48 production growth could see the market loosen significantly should winter weather fail to impress, some analysts say.
Northeast and Mid-Atlantic spot markets continue to run the risk of price spikes this winter, although infrastructure additions should help get more Appalachian production to demand centers. The recently announced delay of two Mexican natural gas pipelines will postpone much needed relief in the constrained Permian, likely leading to increased flaring, possible production shut-ins and price volatility.
And with strained gas import capacity, ongoing restrictions at a key regional storage facility and an unexpected cut in supplies from north of the U.S. border, the West Coast, Pacific Northwest and Rockies are banking on forecasts for mild weather to get them through what could be a tumultuous winter.
A bomb cyclone last winter drove cash prices north of $100/MMBtu in the Northeast. If similar conditions were to materialize this winter, “pipeline constraints on Algonquin Gas Transmission, Transcontinental Pipeline, and Tennessee Gas Pipeline could result in high gas prices at Transco Zone 6 near New York City, Algonquin Citygates in ISO New England Inc., and Transco Zone 5 South in PJM Interconnection LLC,” the Federal Energy Regulatory Commission report said.
Even with the NGI National Spot Gas Average recently above $4.30/MMBtu, however, physical markets this month have seen occasional reports of negative spot prices.
Marketers have been faced with natural gas prices averaging $2.94/MMBtu this year and are likely to see them average $2.98/MMBtu in 2019, according to EIA. Henry Hub prices during December, January and February are likely to average $3.20/MMBtu, EIA said in a recent Winter Fuels Outlook. Raymond James & Associates Inc.’s’ 2019 gas forecast was recently increased to $2.75/Mcf from $2.25.
BP plc held firm to its perennial No. 1 ranking in the NGI survey, reporting 21.01 Bcf/d in 3Q2018, a 5% increase compared with 20.04 Bcf/d in 3Q2017. The London-based supermajor doubled year/year profits in the third quarter and delivered its strongest results in five years. BP’s lower 48 production rose to 321 million boe/d from 304 million boe/d and from 312 million boe/d in 2Q2018.
For a fourth consecutive quarter, Macquarie Energy reported the largest increase in the survey, a 32% increase to 12.71 Bcf/d. The company’s sales have been boosted by its purchase last year of Cargill’s North American Power and Gas trading business. Macquarie was No. 5 in NGI‘s analysis of 2016 Form 552 buyer and seller filings with FERC; Cargill was No. 47 in NGI‘s analysis of 2015 Form 552 filings, buying and selling 669.8 Tbtu.
The NGI survey ranks marketers on sales transactions only. The Federal Energy Regulatory Commission’s Form 552 tallies both purchases and sales.
Tenaska also saw a significant increase compared with the year-ago period, reporting an 11% leap to 10.80 Bcf/d.
However, there were declines among the leaders. Shell Energy NA was No. 4 in the survey with 9.80 Bcf/d, a 5% decrease compared with 3Q2017, and ConocoPhillips reported 8.14 Bcf, down 4%.
Other Top 10 companies reporting increases were Sequent Energy Management (6.80 Bcf/d, up 8% from 6.30 Bcf/d); J. Aron & Co. (5.63 Bcf/d, up 10% from 5.11 Bcf/d); EDF Trading NA (5.50 Bcf/d, up 8% from 5.11 Bcf/d); Direct Energy (5.00 Bcf/d, up 15% from 4.34 Bcf/d); and CenterPoint Energy (3.33 Bcf/d, up 13% from 2.96 Bcf/d). CenterPoint, a natural gas and electric utility based in Houston, plans to acquire Vectren Corp. in a deal valued at $6 billion; the deal is expected to close early next year.
Other highlights of NGI’s 3Q2018 survey include a 10% increase for both Southwestern Energy Co. (3.27 Bcf/d) and Castleton Commodities (2.90 Bcf/d), a 13% increase for Vitol Inc. (2.38 Bcf/d), and a 16% increase for Cabot Oil & Gas Corp. (2.03 Bcf/d).
ARM Energy Management reported 1.96 Bcf/d, a 58% increase. Encana Corp. reported 1.20 Bcf/d, a 28% increase, and Apache Corp. reported 0.65 Bcf/d, a 27% increase compared with 3Q2017.
© 2024 Natural Gas Intelligence. All rights reserved.
ISSN © 1532-1231 | ISSN © 2577-9877 | ISSN © 1532-1266 |