Production Overshadowing Lean Storage, Heat in August Natural Gas Bidweek
With only a few months of injections left, steep natural gas storage deficits remain in key regions, but with production setting records and trending higher, prices haven’t responded.
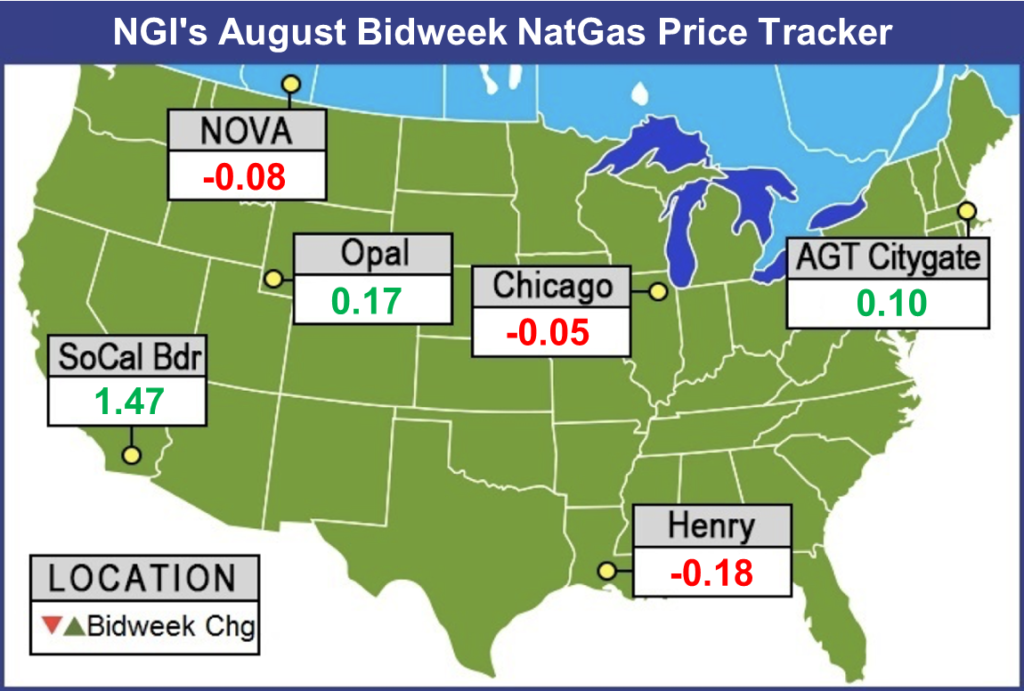
August bidweek traders saw last month’s heat-driven gains evaporate across much of the eastern half of the country, even as hefty gains in the West sent NGI’s National Bidweek Average 12 cents higher to $2.76/MMBtu, which also represents an 11-cent premium to August 2017’s National Bidweek Average of $2.65/MMBtu.
It took a rally into expiry for the August Nymex futures contract to settle at $2.822, leaving benchmark Henry Hub down 18 cents month/month (m/m) and setting the tone for bidweek discounts across the Gulf Coast, Midwest and Southeast.
Significant year/year production growth has seemingly dominated the market’s thinking, overwhelming otherwise bullish indicators, including strong summer cooling demand and lean stockpiles.
The Energy Information Administration’s updated EIA-914 monthly production data showed U.S. natural gas output for May setting a new all-time record. EIA said May 2018 production averaged 80.4 Bcf/d (2,491 Bcf total), an 8.6 Bcf/d (12%) increase year/year (y/y) and the highest total recorded by the agency for data going back to 1973.
“Year over year production growth has been headlined by basins outside Appalachia, with Louisiana (plus 2.19 Bcf/d), Texas (plus 1.87 Bcf/d) and Oklahoma (plus 1.02 Bcf/d) all contributing considerable new output,” EBW Analytics Group CEO Andy Weissman said of the EIA-914 data. “The three Appalachian states have seen output soar by 3.31 Bcf/d over the same period, with Ohio providing nearly half of new production.
“Non-Appalachian output growth accelerated this spring to a stunning 8.2 Bcf/d annualized rate, with both associated gas and Haynesville Shale production picking up,” Weissman said. “As new pipelines are completed and Appalachian growth is layered on top of this strong base rate, soaring output may cast a long shadow over 2019 Nymex futures.”
The EIA data does little to undercut the thesis that y/y supply growth will offset a year-on-five-year inventory deficit that was hovering well above 500 Bcf to close out July.
“Our reference case outlook still centers on end-October storage carryout near 3.45 Tcf,” global consulting firm Energy Aspects said. “Such a low level will result in heavy y/y shortfalls in regional stocks, which have certainly been exacerbated by recent above-normal temperatures. However, what has kept the market in a relative state of complacency in the height of cooling season is an acute upward trajectory in output over the past several weeks and an outlook for record production throughout the heating season.
“That projected supply cushion is fueling a market perception that overall supply length will compensate for the lack of supply stored in the ground ahead of winter,” Energy Aspects said. “Given how much supply growth will be sourced from Appalachia and Texas/Midcontinent, the question is to what extent production growth will be able to compensate for those y/y storage deficits, especially given the bulging withdrawals seen in the Northeast last winter as well as freezing conditions in Texas.”
The East region has seen inventories grow by 298 Bcf since April to reach 527 Bcf at the end of July, according to Morningstar Commodities Research analyst Matthew Hong. This compares to a build of 360 Bcf to reach 626 Bcf over the same period a year ago.
To reach seven-year average inventories of 937 Bcf, the East would need to see weekly injections average 27 Bcf from here, well above weekly injections recorded over the last seven years, which have ranged from 13 Bcf to 24 Bcf, according to Hong.
While regional demand is up about 4% y/y, “supply has seen an 18% increase,” Hong said. “Regional production went from 24 Bcf/d at this time last year to a little over 28 Bcf/d today. Although gas production has seen significant growth, relief of pipeline constraints has helped to move Eastern gas west and south as more areas across the country put additional demands on Eastern production.
“…Although the one-month outlook shows slightly higher temperatures for most of the East Coast, the more granular assessments show a different picture. Most of the heat is expected in the near term…and primarily having an impact on the northern half of the East Coast. In the longer-range three- to four-week outlook, the probability of below-average temperatures from New York down to Florida is higher,” suggesting demand will drop, “moving storage in the right direction.”
Even with higher supply y/y, the East is on track to enter the winter season with the lowest inventories in recent history, and prices have shown some signs of responding, according to Hong, who pointed to gains in Henry Hub futures to close out July and to strengthening in Tetco M3 basis.
“Looking longer term to the upcoming heating season, the perception of a natural gas shortage will likely push prices up, as storage levels stay lower, but flat to moderate growth in production may make tighter storage levels less of a bullish signal,” Hong said. “If prices fail to react in a significant way this season, and storage remains at historically lower levels through the winter, conventional U.S. natural gas market wisdom about the relationship between storage and price may no longer apply.”
East Coast prices were mixed during August bidweek, with Transco Zone 6 New York dropping 7 cents m/m to $2.80 as Algonquin Citygate added a dime to $2.89.
Further upstream in Appalachia, Dominion South added a nickel to $2.39, while Tetco M2 30 Receipt climbed 8 cents to $2.40.
Appalachian takeaway capacity is poised to continue growing over the back half of 2018, with both Atlantic Sunrise and Nexus Gas Transmission nearing full-service. Despite some setbacks at FERC, the remainder of Rover Pipeline’s Phase 2 is expected online during the third quarter, potentially allowing the project to grow into its full 3.25 Bcf/d of designed capacity.
Meanwhile, the South Central storage region as of the week ended July 20 stood at a “sizeable” 302 Bcf y/y deficit, Energy Aspects noted.
“Injection activity over the past several weeks has been anemic due to all-time high” demand in the Electric Reliability Council of Texas (ERCOT) region, “seen several weeks before load typically peaks in Texas in early August,” the firm said. “That high gas demand from power means the current pace of injections in July appears nearly flat versus last year, in spite of production that is 1.5 Bcf/d higher y/y. Given that there was a net inventory drawdown for the region in both August 2016 and August 2017, additional paring of South Central stocks before the shoulder season could be hard to avoid.
“…In May and June, South Central injections were some 1.2 Bcf/d higher y/y,” Energy Aspects said. “If we assume a similar y/y pace in September and October, traditional end-of-season stocks would land just over the 1 Tcf mark. That would put stocks at a 90 Bcf or so deficit to where they ended” in October 2014 after the exceptionally cold 2013/14 winter. “While 2014 saw a net withdrawal, the past three Novembers have all featured a net injection into regional storage,” so stocks could reach 1,030-1,050 Bcf before withdrawals start.
The forward curve has not provided much financial incentive for injections, the firm said.
“The low level of contango at Henry has not rewarded discretionary injections, as is the case with Katy and Houston Ship Channel,” Energy Aspects said. “Given the sizeable share of regional storage that is merchant-driven or arbitrage-driven, there is no financial incentive to inject gas into storage.”
In August bidweek trading, prices generally moved lower throughout the Gulf Coast and Texas, tracking closely with Henry Hub. Houston Ship Channel averaged $2.85, down 16 cents m/m, while Tennessee Line 500 gave up 17 cents to $2.75.
West Texas bidweek prices strengthened but still traded well back of Henry as the region manages surging production and takeaway constraints. Waha added 7 cents m/m to $1.83.
In South Texas, Tennessee Zone 0 South dropped 17 cents to $2.66.
Infrastructure additions helped drive an increase in pipeline exports to Mexico in July, according to RBN Energy LLC analyst Sheetal Nasta.
“After idling near the 4.6 Bcf/d level for months, piped gas flows to Mexico raced to a record of more than 5 Bcf/d for the first time earlier in July, and have hung on to that level since,” Nasta said. “This new export volume signifies incremental demand for the U.S. gas market at a time when the domestic storage inventory is already approaching the five-year low.
“At the same time, it would also signify some much-needed relief for Permian Basin producers hoping to avert disastrous takeaway constraints — that is, if the export growth is happening where it’s needed the most, from West Texas.”
While exports from the Desert Southwest and Waha have contributed to the recent record-level flows across the southern border, “the biggest bump this month has come from South Texas, where more capacity was added recently on the U.S. side,” Nasta said.
Exports out of South Texas had leveled off at around 3.5 Bcf/d since December, “until July, when flows rose to nearly 3.7 Bcf/d, with increases on Kinder Morgan’s Border Pipeline as well as on NET Mexico,” Nasta said. “…Capacity on the Mexico side also got a boost from the new 600 MMcf/d Nueva Era Pipeline.”
A wave of new transport projects — designed to serve gas-fired generation demand in Mexico — are expected to enter service over the next few years, Nasta noted, signifying new demand and takeaway for Permian and Eagle Ford Shale supply. “As such, their timing will continue to be the driving factor in the Texas — as well as the U.S. — gas market balance over the next few years. The precipitous increase in recent weeks is a reminder that, given the wild-card effect of the downstream projects, the growth is likely to occur in fits and starts.”
In the West, after a July heat wave sparked some record-high spot prices, the volatile and constrained SoCal Citygate saw a hefty mark-up in August bidweek, adding $5.57 m/m to average $9.50.
Day-ahead prices at SoCal Citygate — still prone to spikes due to ongoing constraints on pipeline imports into Southern California and limited use of the Aliso Canyon storage field — averaged nearly $40 on July 23, when triple digit heat drove up power prices and demand for gas-fired electric generation. Southern California Gas has recently been forced to compete with heat-driven demand further upstream as prices throughout the region were trading at premiums to close out July.
Bidweek traders clearly felt compelled to brace for more of the same in August, as other locations in Southern California and the Desert Southwest surged. SoCal Border Average climbed $1.47 to $4.19, while Kern Delivery averaged $6.17, up $3.31 m/m.
Further upstream, a number of Rockies points gained double digits for August bidweek. Cheyenne Hub added 14 cents to $2.34, while Kern River gained 17 cents to $2.42.
© 2024 Natural Gas Intelligence. All rights reserved.
ISSN © 1532-1258 | ISSN © 2577-9877 |