June Natural Gas Forward Values Rally as Storage Build Comes Up Short
It was a slow start to the week as strong production and bearish weather kept natural gas forward prices in check, but Thursday’s reported build to storage inventories gave the market a much-needed jolt as it fell far short of expectations. June averaged 11 cents higher from May 4 to 11, according to NGI’s Forward Look.
Early in the week, the market appeared to be in limbo as production held around the 78 Bcf/d mark, weather shifted from a cold April to a warm early May and recent storage data indicated meaningful demand growth had arisen to offset the increase in year-over-year supply. Total storage declined by 11 Bcf during April, the first April on record that has posted a net withdrawal versus a build.
Before Thursday’s storage report from the U.S. Energy Information Administration (EIA), analysts with Mobius Risk Group said a string of triple-digit storage injections “would probably be enough to generate further downside probes, however, warmth in the forecast will quickly become bullish if the current weather pattern persists through late May and into June.”
Indeed, the most recent seven-day weather outlook from NatGasWeather shows temperatures remaining warm as daytime highs reach the 70s and 80s over the middle of the country, with highs in the southern United States in the upper 80s to 90s, locally 100s over the Southwest. The third week of May was expected to continue seeing weak weather systems across the far northern part of the country, with warm to very warm over conditions over most of the rest.
In futures action, the Nymex curve posted solid gains through the winter 2018-2019 strip as the market began to digest the implications of the smaller-than-expected build to storage. The June futures contract was up 10 cents during that time to $2.814, July was up 9 cents to $2.828, the balance of summer (July-October) was up 9 cents to $2.83 and the prompt winter was up 7 cents to $2.96.
The EIA reported an 89 Bcf injection into Lower 48 gas stocks for the week ending May 4, versus consensus estimates for a build in the low- to mid-90s. Last year, EIA recorded a 49 Bcf injection. The five-year average is a build of 75 Bcf.
Total working gas in underground storage ended the period at 1,432 Bcf, versus 2,295 Bcf a year ago and five-year average inventories of 1,952 Bcf. The year-on-year deficit shrank week/week from minus 903 Bcf to minus 863 Bcf, while the year-on-five-year deficit decreased slightly from minus 534 Bcf to minus 520 Bcf, EIA data show.
Still, market reaction to the report was swift. Shortly after the 10:30 a.m. ET release of the final number, the June contract popped about 3 cents to trade above $2.785 after already gaining a few cents earlier in the session. The prompt month eventually settled 7.7 cents higher at $2.814.
After the reported 89 Bcf injection, “the market found some life; however, the potential for a string of triple digit injections over the next three to four weeks could limit upside potential,” Mobius analysts said. They also noted that over the first nine days of May, “weather has been extremely mild, production has held on to material year-over-year gains, and yet storage data indicates the market is not 5 Bcf/d oversupplied versus last year like many analysts postulated toward the end of withdrawal season.”
Indeed, Jefferies LLC analysts said while production was up ~6.0 Bcf/d year/year in April, residential/commercial demand increased by 7.2 Bcf/d, more than offsetting the increase in supply. Also posting year/year gains were power demand, which was up 1.2 Bcf/d; industrial demand, which was up 0.9 Bcf/d; liquefied natural gas exports, which were up +1.5 Bcf/d; and Mexican exports, which were up 0.4 Bcf/d.
In addition, the EIA expects around 32 gigawatts (GW) of new electric generation to come online during the remainder of 2018, of which 21 GW is expected to be natural gas-fired generation.
Data and analytics company Genscape Inc. said natural gas has already recaptured the majority share of the U.S. generation market from coal. Last summer, gas was used to generate more megawatts than coal, but by mid-November, coal had recaptured its lead over gas. In early February, however, the ratio once again flipped in favor of gas.
“Since then gas has had a 1.14-to-1 ratio over coal and accounted for roughly 32% of the total generation stack across all fuels,” Genscape Senior Natural Gas Analyst Rick Margolin said.
Margolin also noted that gas’ share of the generation stack is about 2% higher than last year-to-date. “This is notable given that total generation is about 7% higher this year”, and pure megawatt output from coal, nukes and renewables are higher. This year, however, gas has been able to show larger year/year growth than those other fuels, “grabbing a larger share of the generation pie from coal and nuclear,” he said.
Meanwhile, there are 26 weeks remaining in the traditional storage injection season, and 14 of those are subject to “potentially parabolic gains in cooling demand. The 12 weeks on either side of peak summer will need to see materially larger-than-normal injections for the year/year deficit to be significantly eroded,” Houston-based Mobius said.
But NatGasWeather forecasters said they still look to the end of May for the southern United States to experience sustained and widespread highs of 90s, and “when it does, it will provide valuable insight to just how strong power burns will be this summer, needing to increase at least several Bcf/day to partially offset record production.”
Still, one thing that has becoming obvious, forecasters said, is that it’s going to take quite some time to reduce storage deficits back towards -400 Bcf, which likely won’t occur until late June or beyond, assuming near normal weather. “The next several weeks will be important as hefty builds better not disappoint or the markets will quickly realize summer deficits will remain quite large for quite some time, if not being added to, especially if this summer comes in hotter than normal, as we expect,” NatGasWeather said.
It is projecting the next EIA storage report (for the week ending May 11) to print a build near or over 100 Bcf, easing deficits to around -500 Bcf as the build comes in around +20 Bcf larger than the five-year average.
SoCal CG Sees $3 and $4 Gas; Cal2021 Slips on Solar Mandate
Ongoing pipeline import limitations in California and strong demand expected over the next couple of weeks led to gains at the SoCal City-gate that were more than double those seen at the benchmark Henry Hub, lifting some forward packages above the $4 mark.
Genscape projected demand in California to reach 4.48 Bcf/d on May 11 but then soar to 6.00 Bcf/d by Monday and remain there for the rest of the week. The following work week — May 21-25 — also was expected to see demand hold around 6.00 Bcf/d.
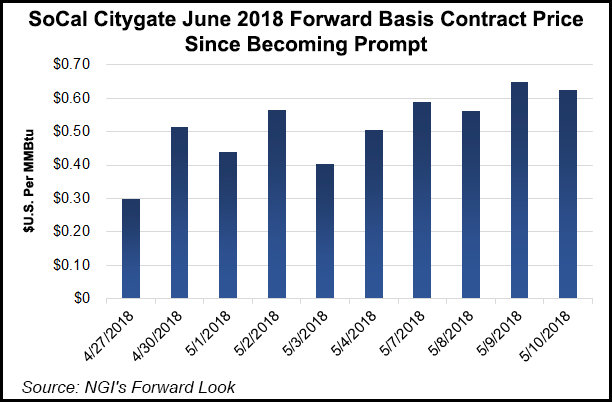
With ongoing import limitations and restrictions at the Aliso Canyon storage facilities, SoCal CG June forward prices shot up 22 cents from May 4-10 to reach $3.439; SoCal CG was the lone pricing point to have a $3 handle for June, according to Forward Look. July jumped 31 cents to $4.096, the balance of summer (July-October) rose 29 cents to $3.86 and the winter 2018-2019 surged some 40 cents to $4.03.
But news this week that the California Energy Commission adopted a rule requiring all new homes built after Jan. 1, 2020, be equipped with solar sent prices for calendar year 2021 (Cal’21) marginally lower. The SoCal CG Cal’21 stripped lost a penny from May 4-10 to reach $2.70.
Citing information from the California Solar Association, Margolin said the rule could lead to 65,000 more residential solar additions per year in the state. “According to the California Public Utilities Commission, there is presently about 4 GW of residential solar generation already installed in the state,” he said. “This is in addition to utility-scale, grid-tied solar. Grid-connected solar generation has been growing at an average annual rate of more than 9 GWh/d since 2012. First quarter 2018 solar generation is up 63% (21.4 GWh/d) from 1Q2017.”
© 2024 Natural Gas Intelligence. All rights reserved.
ISSN © 2577-9915 | ISSN © 2577-9877 |