E&P | NGI All News Access | NGI The Weekly Gas Market Report
Louisiana, Appalachia Lead Way as U.S. Natural Gas Production Sets Records
U.S natural gas production as measured by gross withdrawals reached 90.9 Bcf/d in 2017, the highest volume on record, the U.S. Energy Information Administration reported Tuesday.
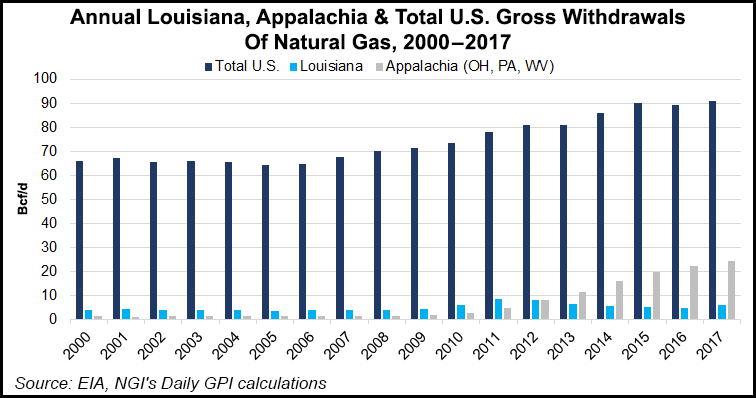
Starting in July 2017, gross U.S. gas withdrawals increased for five straight months, ultimately reaching a record monthly high of 96.7 Bcf/d in December, according to the EIA’s Monthly Crude Oil, Lease Condensate, and Natural Gas Production Report. Louisiana saw the largest total volumetric gain in gross withdrawals in 2017, increasing to 5.8 Bcf/d, up from 2016 production of 4.8 Bcf/d.
“Economic and technological advancements and increased drilling have resulted in growth in natural gas production from Louisiana’s Haynesville play,” EIA said.
The Appalachian region for the second year in a row remained the largest gas producing region. Output from the Marcellus and Utica/Point Pleasant plays of Ohio, West Virginia and Pennsylvania saw gross withdrawals increasing to 24.3 Bcf/d in 2017 from 22.2 Bcf/d in 2016, EIA said. Ohio had the largest percentage increase in gross gas withdrawals, increasing 24% in 2017 to 4.9 Bcf/d.
Texas, meanwhile, posted the largest volumetric decline of any state for gross withdrawals, falling from 22.2 Bcf/d in 2016 to 21.7 Bcf/d in 2017. The Lone Star State, however, remained the largest gas producing state with gross withdrawals of nearly 7 Bcf/d more than the No. 2 state, Pennsylvania.
Marketed gas production also reached an annual record high of 78.9 Bcf/d last year, with the monthly record high of almost 84.0 Bcf/d set in December. Marketed production reflects gross withdrawals minus natural gas used for repressuring reservoirs, quantities vented/flared, and nonhydrocarbon gases removed in treating or processing operations.
The EIA also reported that total natural gas exports through pipelines and as liquefied natural gas (LNG), grew about 36% in 2017, with LNG exports nearly quadrupling. As such, the United States became a net gas exporter in 2017 for the first time in nearly 60 years, as EIA previously noted.
Dry gas production came in at an annual level of 73.6 Bcf/d, but didn’t set a new record. Dry gas is consumer-grade natural gas, or marketed production minus extraction losses, the EIA noted.
EIA’s monthly production report collects oil and natural gas production data from a sample of operators in 15 states, the Federal Offshore Gulf of Mexico and collectively from the remaining states and the Federal Offshore Pacific.
Henry Hub 2018, 2019 Forecasts Mirror March
On Tuesday, EIA also issued the Short-Term Energy and Summer Fuels Outlook, predicting dry gas production will average 81.1 Bcf/d in 2018, establishing another record. Gas production is forecast to rise by 1.7 Bcf/d in 2019.
The federal agency is forecasting U.S. gas consumption to increase by 4.2 Bcf/d (5.7%) in 2018 and by 0.7 Bcf/d (0.9%) in 2019, with electric power generation the leading contributor. Meanwhile, net gas exports should rise to an average of 2.2 Bcf/d in 2018 and 4.4 Bcf/d in 2019 from an average of 0.4 Bcf/d in 2017.
Gas inventories ended March at almost 1.4 Tcf, which was 19% lower than the previous five-year average.
“Based on a forecast of rising production, EIA forecasts that natural gas inventories will increase by more than the five-year average rate of growth during the injection season (April-October) to reach almost 3.8 Tcf on Oct. 31, which would be 2% lower than the previous five-year average,” researchers said.
Henry Hub spot prices are forecast to average $2.99/MMBtu in 2018 and $3.07 in 2019, mirroring the March EIA forecast.
The average New York Mercantile Exchange futures and options contract values for July 2018 delivery that traded during the five-day period ending April 5 “suggest that a range of $2.30/MMBtu to $3.43/MMBtu encompasses the market expectation for July Henry Hub natural gas prices at the 95% confidence level,” EIA said.
The forecast for U.S. oil production also is strong. Domestic output averaged 10.4 million b/d in March, up 260,000 b/d from February, according to EIA. Total U.S. crude oil production averaged 9.3 million b/d in 2017.
Average U.S. oil output now is forecast to average 10.7 million b/d in 2018, “which would mark the highest annual average U.S. crude oil production level, surpassing the previous record of 9.6 million b/d set in 1970,” said EIA. Next year’s oil output is expected to increase again, averaging 11.4 million b/d.
West Texas Intermediate (WTI) oil prices are seen averaging around $4.00/bbl lower than Brent prices this year and in 2019; Brent averaged $66/bbl in March and is seen averaging around $63 in both 2018 and 2019.
© 2024 Natural Gas Intelligence. All rights reserved.
ISSN © 1532-1231 | ISSN © 2577-9877 | ISSN © 1532-1266 |