Markets | NGI All News Access | NGI The Weekly Gas Market Report
Production, Storage, Forward Curve Put Analysts at Odds on Natural Gas Price Direction
An otherwise positive fundamental backdrop for the natural gas market continues to butt heads with rampant production in the Lower 48, leaving industry analysts at odds over which direction prices are heading for the remainder of the year.
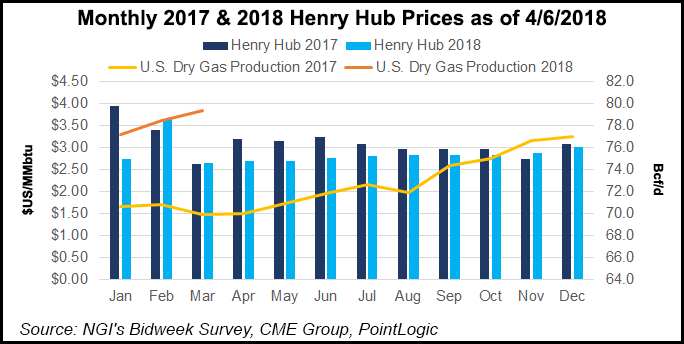
Cash prices averaged $2.99 between November and March, on par with average prices during the winter 2016-2017. This occurred despite a 3.5 Bcf/d year/year increase in residential/commercial demand resulting from a winter that was 13% colder than last winter, according to report in late March by Barclays Capital. Export levels, including pipeline and liquefied natural gas (LNG), were up 1.5 Bcf/d y/y.
Meanwhile, underground natural gas storage inventories ended the traditional withdrawal season far below historical levels, according to the U.S. Energy Information Administration. Inventories for the week ending March 30 were reported to be 1,354 Bcf, down 697 Bcf from a year ago and 347 Bcf below the five-year average.
However, a look at the remainder of the summer strip from May through October indicates prices are trading at a nearly 20-cent discount to where cash prices averaged last summer ($2.97), historic Daily GPI data show. The remainder of the Calendar 2018 (Cal2018) strip (May-December) showed prices averaging more than 10 cents below the 2017 average.
The reason for the current weakness in pricing is simple. Natural gas production in the Lower 48 had already reached record levels of more than 79 Bcf/d in March and is expected to continue growing throughout the year. Barclays expects production to grow 6.4 Bcf/d above 2017 levels.
Analysts at BMO Capital Markets (BMO) agreed that rising production, both from associated gas growth in the Permian Basin and shale gas production from Appalachia and the Haynesville Shale, will keep the market well-supplied. Analysts see “little prospect for materially higher gas prices.” Henry Hub prices are forecast to remain in $2.50-3.50 trading range for the foreseeable future, but BMO lowered its price forecast for 2018 to $2.84 from $2.92 and maintained its $3.00 forecast for 2019.
The market’s confidence in growing production, however, has weakened the 2018 forward curve to levels that are perhaps too low, Barclays said. “Although it is hard to make a fundamentally bullish case for natural gas given forecast production growth, the current summer curve appears to be underpriced.”
Storage levels are expected to enter summer 17% lower than the five-year average versus last summer, when storage started summer around 15% above the five-year average, the investment bank said. Although production should be up 7 Bcf/d summer-on-summer, total exports are expected to be up around 1.8 Bcf/d, while power burn should be around 300-400 MMcf/d, assuming the bank’s current average price forecast of $3.22 for 2Q2018 and $3.01 for 3Q2018.
If prices were to stay at the $2.70 level over the course of the summer, that should boost coal-to-gas switching by around 700 MMcf/d to 1 Bcf/d, meaning an extra 150 Bcf to 214 Bcf of power burn during April-October. “We see prices having to move closer to $3.00/MMBtu this summer in order to lower these power burn levels and allow adequate storage refills ahead of winter,” Barclays analysts said.
A BofA Merrill Lynch Global Research report in late March also noted that fundamentals for natural gas are more positive than current forward prices imply, with analysts seeing upside to Cal2018 contracts.
Record production that continues to grow is hard to ignore. Analysts at Jefferies LLC in March lowered their natural gas price outlook for 2018-2019 to $2.80/Mcf and their long-term forecast to $3.00 (both down from $3.25), citing “much stronger-than-expected” supply growth over the last two months of 2017 and continuing into early 2018.
Although production growth slowed in March, increasing only around 0.3 Bcf/d from February from an average growth rate of around 1 Bcf/d per month from November through February, Jefferies expects production to “grind higher throughout the remainder of 2018,” climbing above 83 Bcf/d (6.3 Bcf/d year/yar) by the end of 2018.
Given the production outlook, Jefferies analysts said they see limited upside to strip pricing over the next two years, especially as LNG export growth slows until additional trains enter service in mid to late 2019. Growth should slow significantly in 2018 as only two additional trains are scheduled to enter service this year. The large step-up in LNG exports is expected in in 2019, with more than 5 Bcf/d of export capacity expected to enter service, bringing total export capacity to 9 Bcf/d-plus, which if running at full service, could push demand above 10 Bcf/d when accounting for fuel gas used in the plants, it said.
Meanwhile, Mexican export growth is also expected to remain limited because of pipeline constraints downstream, while power demand growth will be limited by slowing coal plant retirements, Jefferies said.
Still, Barclays analysts noted that even as production is set to grow at record levels in 2018, most of the supply coming online is in the Northeast and Permian Basin. This growth “does not match incremental demand growth, which will largely come from the Gulf Coast.” This could potentially set up a situation that presents a more bullish Henry Hub story even with growing production.
That’s the very scenario BTU Analytics senior energy analyst Jason Slingsby shared at the company’s February conference in Houston, when he said pipeline constraints and limited demand growth in supply basins outside the Gulf Coast would hold down prices there, while Henry Hub would find support from exports and increased power demand.
Indeed, Barclays noted that early weather forecasts for the summer from MDA Weather Services point to a relatively hot summer with the May-September forecast coming in warmer than both the 10- and 30-year averages. Total gas-weighted cooling degree days are forecast to come in at 1,290, which is slightly above last year’s levels of 1,241. “We think the additional warmth, if forecasts are correct, could boost power burn by around 700 MMcf/d from our base-case assumption,” it said.
As of March 27, Barclays was forecasting gas prices for the remainder of 2018 to average $2.97, up from its February forecast of $2.80.
Global Gas Price Convergence Coming
Global gas prices have strengthened relative to coal over the winter, and the Japan Korea Marker (JKM) index, which is the benchmark price assessment for spot physical cargoes delivered ex-ship into Japan and South Korea, briefly reached parity with Brent crude oil on a dollar-per-MMBtu basis, according to a late March report by Goldman Sachs.
China, where gas demand is driven by environmental policies rather than economic incentives, is largely behind this rally. Goldman analysts said the recent spike in Asian demand would have had a more limited impact on gas prices if the LNG market was able to allocate molecules efficiently. Instead, suboptimal LNG trade flows amplified the marginal cost of supply in these periods of high demand.
As such, analysts see the transition toward optimized trade flows and tighter regional price spreads taking longer than previously anticipated, “with Asian buyers continuing to rely on high-cost suppliers during periods of peak demand in 2018-19.” This transition is nonetheless taking place, as companies seek contracts free of destination restrictions that, over time, should contribute to the gradual convergence in global gas prices.
Until global gas price convergence occurs, Goldman analysts expect Asia buyers to continue to rely on the flexibility provided by oil-indexed contracts. As lower cost supply alternatives become available and fewer consumers exercise that option, however, “we expect the JKM index to continue its shift lower relative to oil during such peak demand periods.”
During the rest of the year, the lack of storage capacity in Asia should keep Europe as the clearing market for a seasonally oversupplied global gas market against coal, it said. This will drive further convergence between gas and coal prices, given rising LNG supply but stable export volumes for coal.
Meanwhile, coal’s market share in the power sector should continue to decline, although China has an incentive to support prices until its domestic producers have sufficiently deleveraged. As a result, while gas will continue to price to displace coal, China’s support of coal prices will in turn provide a higher gas clearing price, Goldman said.
Rosy Outlook For Oil
While the outlook for gas pricing is bleak, crude oil prices have been on the rise, and most analysts are raising their price forecasts for the year amid heightened geopolitical risks in the Middle East and ongoing turmoil in Venezuela, as well as improving fundamentals.
BMO in early March raised its 2018 West Texas Intermediate (WTI) assumption to $61/bbl from $52.25/bbl and its 2019 assumption to $57/bbl from $54/bbl. BMO attributed the lower price projection for 2019 to U.S. producers responding to the higher price environment.
Still, the investment bank said it appears that crude oil prices have settled into a new, higher trading range since the end of 2017, and improving fundamentals should support prices and minimize the likelihood of a collapse.
In addition, compliance by members of the Organization of the Petroleum Exporting Countries, which agreed to reduce output through this year, “has been very strong,” and Venezuelan production does not appear to be rising anytime soon; “indeed, there is a real risk of a collapse in Venezuelan oil production that would send oil prices materially higher,” BMO said. Accordingly, it believes the trading range for WTI crude oil could be sustained in the $55-65/bbl range in 2018 and 2019.
But analysts at BofA Merrill Lynch Research said OPEC’s cohesion thus far has acted as a price anchor for the oil market and continues to be the “untested assumption” that it operates with 3.6 million b/d of spare capacity.
“This assumption could turn out to be wrong if OPEC is unwilling or unable to increase output in a rising oil price environment,” analysts said last month. “A shortfall in OPEC barrels could eventually exacerbate the ongoing crude oil and petroleum product inventory drain and lead to an upside oil price spike.”
Still, geopolitical risks do provide some upside risks to price forecasts, the analysts said. They see WTI prices potentially hitting $70/bbl around mid-year, but then averaging $60/bbl for the year. For its part, Goldman sees WTI averaging $72.50/bbl for 2018, although most producers are hedged between $50-60/bbl, “resulting in hedging losses for the vast majority of our coverage.”
Tudor, Pickering, Holt & Co. Inc. (TPH) analysts agreed that “a strong near-term hedge book could be more curse than blessing” as it sees 2018 oil 32% hedged at $53/bbl. The investment bank, however, lowered its long-term WTI price forecast to $52/bbl from $54, and sees producers likely sticking to budgeting WTI at $50-55/bbl despite 1Q2018 averaging $63/bbl.
Going forward, BMO analysts expect that the ability of U.S. producers to grow production will determine the sustainable ceiling price for crude oil. Based on the industry’s current cost structure, crude oil prices above $60/bbl could result in too much growth in U.S. production and potentially weaker crude oil prices. Similarly, prices below $50/bbl could reduce the rate of growth.
“To date, U.S. producers have shown restraint and not materially increased capital budgets in response to higher oil prices,” said BMO. As that restraint wavers, we expect activity and production levels to increase.”
© 2024 Natural Gas Intelligence. All rights reserved.
ISSN © 1532-1231 | ISSN © 2577-9877 | ISSN © 1532-1266 |