NatGas Forwards Bleed Red On Weather, Production and Storage
Natural gas forward prices for March plummeted by an average 41 cents from Jan. 26 to Feb. 1 as warmer weather outlooks, a return to record production levels and an improving storage picture took a hatchet to prices across the curve, according to NGI’s Forward Look.
The week actually began on a strong note when the expiring Nymex February gas futures contract settled at a multi-month high of $3.631. March futures ended Monday nearly flat at $3.167. Tuesday brought about a modest gain of about 3 cents for March, pushing the contract to roughly 65 cents above its December low.
But any upward momentum came to a screeching halt on Wednesday when warmer weather models overnight Tuesday led to the March futures contract opening some 15 cents lower and then eventually closing the day down 20 cents to just under $3.
In addition to the warmer weather outlooks for February, market positioning and summer 2018 strip pricing were also likely factors impacting the front of the curve, Mobius Risk Group analysts said. Commodity Futures Trade Commision data as of Jan. 23 indicated speculative market positions had shifted from approximately 60,000 contracts net short in late December to long more than 150,000 contracts.
“The size of net length alone had the market ripe for a price retreat, and the pace of the shift suggests recently added positions were not as easily defensible in the face of warmer weather forecasts,” analysts said.
Tuesday’s modest strength along the futures curve put the summer 2018 strip to within one day’s trading range of 12-month highs, and “this may have very well brought additional producer molecules to market,” Mobius analysts said.
The bloodshed in the futures curve continued on Thursday, when the March contract tumbled another 14 cents to $2.856. And even though the central and eastern portions of the U.S. were expected to see cold air return beginning over the past weekend and then linger through the week, the market remained solely focused on the 11-15 period of growing warm risk.
Weather data overnight Thursday were slightly colder for late in the week, again focused on a weather system arriving into the northern and eastern U.S. Feb. 8-10, but still with the frigid arctic cold pool retreating north into Canada Feb. 11-15, NatGasWeather said.
“There’s expected to be at least four weather systems track across the northern and eastern U.S. the next two weeks, including the one that’s currently sweeping through the East, just not as cold as the data suggested early in the week. This has clearly disappointed the markets with prices down nearly 10% off Monday’s highs,” the weather forecaster said.
Clearly, cold will again be needed for the second half of February if recently established bearish weather sentiment is to return bullish, which will still be battling Lower 48 production setting fresh record levels, NatGasWeather said.
In a recent note, analysts with Tudor, Pickering, Holt & Co. (TPH) indicated that battle has already begun as Lower 48 dry gas production hit a record 77.6 Bcf/d Monday, while heating degree day (HDD) forecasts for the first week of February “were lackluster, keeping with last week’s trend.”
Meanwhile, commercial start-up of the Dominion Cove Point liquefied natural gas (LNG) export terminal was “delayed until March, further pushing out any LNG export growth above the current roughly 3 Bcf/d ceiling.”
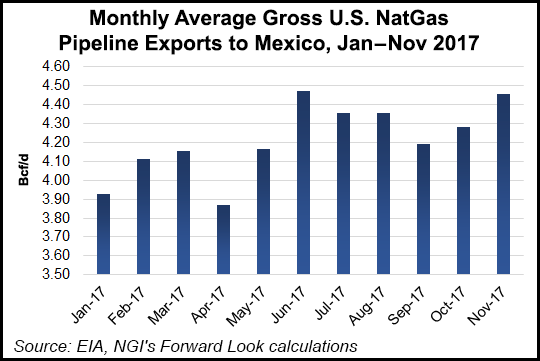
Patrick Rau, NGI’s Director of Strategy and Research, added that demand for the winter of 2017-18 is more dependent on weather than it otherwise was expected to be because of delays in Mexico pipeline infrastructure, and, to a lesser extent, the Cove Point liquefaction facility.
“By our count, at least 3.7 Bcf/d of pipeline capacity either into or within Mexico that was supposed to have been in service in 2017 is still not operational, and the delay of Cove Point until early March pushes out another 800 MMcf/d of so of demand,” Rau said.
There’s no guarantee that 100% of that total Mexico and Cove Point capacity would have been utilized this winter, of course, but “even a fraction of that could have helped absorb the record production levels being turned in today,” he added.
Analysts with Jefferies LLC pointed to numbers showing production surpassing the 78 Bcf/d mark.
“Supply in the first half of January was impacted by freeze-offs and averaged 75.5 Bcf/d (including falling as low as 72.6 Bcf/d on a single day), but production rebounded in the back half of the month, averaging 77.2 Bcf/d, roughly in line with December 2017 levels,” analysts said. Supply reached a new daily high during the last week of January and surpassed 78 Bcf/d for the first time and “has since exceeded that level on three days.”
Meanwhile, Thursday’s storage report from the U.S. Energy Information Administration (EIA) proved to a bearish one, especially considering the slew of bullish surprises during the past month which included a new record withdrawal and another that tied for second largest draw.
The EIA reported a storage draw of -99 Bcf for the week ending Jan. 26, slightly below market expectations of between 100 Bcf and 110 Bcf withdraw.
While this wasn’t terribly bearish against expectation, and even bullish compared to last year’s -92 Bcf draw, it wasn’t impressive enough to warrant a change in the already weaker prices,” Mobius analysts said.
Total working gas in underground storage stood at 2,197 Bcf as of Jan. 26, versus 2,723 Bcf a year ago and a five-year average 2,622 Bcf, according to EIA. The current year-on-year deficit increased week/week from -519 Bcf to -526 Bcf, while the year-on-five-year deficit shrank from -486 Bcf to -425 Bcf, EIA data show.
Taking a closer look at the individual markets, much of the country posted losses that were in line with the weakness seen in the Nymex futures strip. The Nymex March contract shed 31 cents from Jan. 26 to Feb. 1 to settle at $2.856. April was down 14 cents to $2.793 and the summer 2018 was down 9 cents to $2.85. The next two winter strips shifted less than 5 cents, with the winter 2018-2019 slipping 4 cents to $3.06, but the winter 2019-2020 gaining 3 cents to $2.94.
With the mostly milder weather on tap for February in the Northeast, prices in the region posted the most substantial losses across the forward curve. New England’s Algonquin Gas Transmission City-gates (AGT CG) March forward prices plunged $1.19 from Jan. 26 to Feb. 1 to reach $6.198; AGT CG was the only pricing hub across North America to post a loss of more than $1 across the curve, according to Forward Look.
The dramatic declines essentially ended there, however, as AGT CG April forward prices fell only 5 cents to $3.332 and the summer 2018 slipped 4 cents to $2.84. The upcoming winter strip tumbled an impressive 21 cents to $7.24.
Several points along the Transco pipeline plunged 71 cents at the front of the curve, while Transco zone 6-New York saw March forwards slide 89 cents from Jan. 26 to Feb. 1 to reach $3.881. April was down just 7 cents to $2.72, while summer 2018 picked up 4 cents to hit $2.60. The winter 2018-2019 strip, meanwhile, slipped a nickel to $4.94, Forward Look shows.
Most other points in the Northeast and greater Appalachia posted losses equal or greater than those seen along the Nymex futures curve.
The significant losses occurred even as Columbia Gas Transmission (TCO) issued a critical day notice beginning Feb. 2 facing cold weather and potentially large storage draws as the next wave of cold weather moves into the region.
The pipeline issued the notice on the eastern portion of its system, including Virginia, eastern Pennsylvania, Maryland and southeastern New York, with forecasts calling for an average of 34 HDDs over the week, which is 8 HDDs above normal.
Weather-based pipe demand in Appalachia is anticipated to reach 20 Bcf this weekend, which is 4.2 Bcf above the 2015-2017 first week in February average, according to data and analytics company Genscape, Inc. Potentially causing further strain on the system, TCO storage levels are lower than the five-year average coming out of January. Genscape estimates inventories are 46% full, with the largest inventory declines year over year coming out of Ohio (18.2 Bcf) and West Virginia (6.6 Bcf).
© 2024 Natural Gas Intelligence. All rights reserved.
ISSN © 2577-9915 | ISSN © 2577-9877 |