Arctic Cold Blast Drives Balance-of-Winter NatGas Prices Up Avg. 32 Cents
With weather forecasters throwing out words like “arctic blasts” and “sub-freezing conditions”, natural gas traders finally took notice of the cold weather that has blanketed the United States since Christmas and is expected to last through at least the first week of January. February natural gas forward prices rose an average 35 cents from Dec. 22 to 28, while March shot up an average 29 cents, according to NGI’s Forward Look.
Nymex futures led the charge, and most days during the short holiday week ended in the black as persistent cold weather outlooks, strong cash prices and a quickly deteriorating storage picture pushed market bears into “panic mode”, according to analysts at Mobius Risk Group.
While cold temperatures began moving across the northern and eastern parts of the country during Christmas weekend, even more bitter conditions are on tap for the week ahead. “This could give us a few days of the strongest gas demand the nation has seen in years,” Mobius said.
Additionally, the arctic front making its way across the country — which is expected to send overnight temperatures in some northern areas down to as low as minus 25 degrees Fahrenheit according to some forecasters — could lead to freeze-off production cuts possibly from Wyoming to the Northeast and even down into the Barnett in Texas over the New Year’s weekend.
“These could be substantial in cumulative,” Mobius said.
Indeed, data and analytics company Genscape Inc. said Friday that its Spring Rock production team estimates there is about 1.12 Bcf/d of Lower 48 production already shut-in due to freeze-offs, primarily in the Bakken, Pennsylvania and Oklahoma.
Western Canada appears to be dealing with freeze-offs, too. Genscape estimated there was about 0.7 Bcf/d of Alberta production shut-in as daytime highs across the province plummeted from the mid-30s Fahrenheit during the week before Christmas to negative single-digits starting on Christmas Day.
“Alberta producers are equipped to deal with such cold, but freeze-offs there do occur early in the winter when there are radical temperature swings like this. So far, we believe there has been a cumulative 2.4 Bcf of Alberta production shut-in over the past five days,” Genscape said.
The Louisville, KY-based company said it may take a while for Canadian volumes to recover as daytime highs around Calgary are forecast to remain firmly in negative territory through Dec. 31 and then remain about 8 degrees below the seasonal norm of 28 for the first week of January.

The bone-chilling temperatures have also led to restrictions on numerous pipelines across the country, including but not limited to Algonquin Gas Transmission, Tennessee Gas Pipeline, Texas Eastern Transmission, Natural Gas Pipeline Company of America and Northern Natural Gas, the last of which coincided with spot gas at Northern Natural Ventura trading as high as $100 Thursday. Prices ultimately averaged $64.49. At Northern Border Ventura, midday prices traded as high as $95 and ultimately averaged $42.47.
Previously, the highest trade NGI ever recorded for Northern Natural Ventura was $80 on January 27, 2014. Prices that day averaged $55.62, Daily GPI historical data show. The previous record at Northern Border Ventura occurred that same day, when spot prices traded as high as $85 and averaged $49.30.
The strong gas demand currently gripping the nation isn’t expected to let up anytime soon. The latest weather data midday Friday retained frigid conditions through at least the first week of the new year.
Chicago is forecast to have just one day (Wednesday) where the high temperatures will break out of the teens. Otherwise daytime highs are forecast to run more than 15 degrees below the normal of 32, according to Genscape meteorologists.
In Minneapolis, highs on Saturday and Sunday are forecast at just minus 3 degrees. The warmest days of the week will be Tuesday and Friday at 13 degrees, which is still well below the 24-degree norm.
East markets will be cold, too. New York will warm up after Tuesday with highs on Wednesday and Thursday reaching 28, but that is still 10 degrees below normal. Similarly, Boston gets modestly warmer each day through Wednesday when highs reach 28, 8 degrees below normal, but will get colder again towards Friday.
Even in Texas, daytime highs in Dallas are not forecast to exceed 40 throughout the week, 16 degrees below normal. Houston is forecast to top out at 50 by Wednesday, 13 degrees below normal, and then cool down again on Thursday.
With such strong demand, the market is undoubtedly keeping an eye on the quickly deteriorating storage picture. On Thursday, the U.S. Energy Information Administration (EIA) reported a 112 Bcf withdrawal for the week ending Dec. 22, versus a 233 Bcf withdrawal last year and a five-year average withdrawal of 111 Bcf. The prior week, the EIA reported a 182 Bcf withdrawal.
While the report generally fell in line with market expectations, all eyes will be on the next few reports ahead. Total working gas in underground storage stood at 3,332 Bcf as of Dec. 22, with the year-on-five-year deficit at -85 Bcf for the period and the deficit versus last year at just -62 Bcf, EIA data show.
Houston-based Mobius said the extreme cold blanketing the country for the next week or more will lead to storage withdrawals that will be well over 200 Bcf and could even break 300 Bcf level for the Jan. 5 week.
“This would be the largest weekly storage draw going back at least seven years,” Mobius said. “Additionally, these next few storage numbers will go against what was one of the warmest Januarys on record last year, so that storage deficit is going to quickly expand in the next few weeks.”

Looking beyond Jan. 7, NatGasWeather said it continues to expect a very brief break across the U.S. East on Jan. 8, although this has trended less impressive and shorter in duration compared to what the data advertised early in the week. Another cold shot is expected to quickly follow on its heels, arriving Jan. 9-10, it said.
After Jan. 11 is where the weather data gets murky, although NatGasWeather said the latest data has a slight mild trending bias. Even that, however, has considerable uncertainty due to continuously colder trends up until then.
“Why it took the nat gas markets so long to price in the current series of Arctic blasts is baffling since it was convincing in all of the weather data last week when prices were selling off sharply in spite of it. Now that prices are suddenly more than 40 cents higher, it makes last week’s selling even more curious,” NatGasWeather said.
One observer suggested that unlike the 2013-14 polar vortex, there is little or no snow incorporated in the current arctic blast. Since there is nothing to film, it has escaped the instant attention and escalation of the TV news cameras, and others.
As long as cold shows promise for the second half of January as deficits in supplies versus the five-year average balloon to near -350 Bcf, prices could still have room to run higher, the forecaster said. Any signs of a milder regime over the North and East after Jan. 11, however, and the markets could quickly give back some of the recent gains.
“It’s clearly a dangerous weekend to hold when considering last year after the long New Year’s holiday, prices crashed nearly 10% off milder trends,” NatGasWeather said.
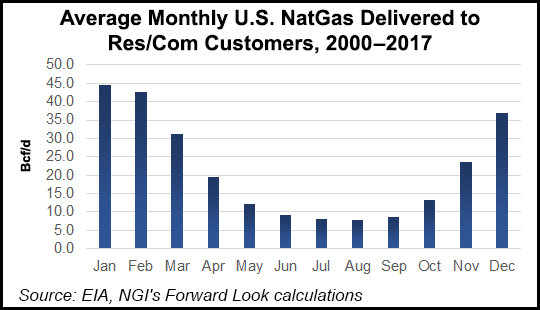
NGI Director of Strategy and Commodity Research said despite the recent price rally, it’s important to note that residential/commercial (res/com) demand isn’t quite as important to total U.S. demand as it once was, falling from 40% in 2003 to 30% in 2016.
“It is still, however, a very important component. Furthermore, while total res/com demand has been flattish since the turn of the millennium, it can still vary widely from year to year, which of course can impact prices for the rest of the calendar year,” Rau said.
Since 2000, no month has seen more res/com demand than January, coming in at an average of 44.4 Bcf/d, followed closely by February at 42.8 Bcf/d, and then December at 36.9 Bcf/d, Rau said.
“So we definitely have the potential for winter pricing to linger around for awhile, but given record high production levels, it likely will take a sustained period of arctic temperatures to give 2018 any kind of chance to average more than $3,” Rau said.
The Nymex February gas futures contract traded in a tight range of about 5 cents for most of Friday, but sold off toward the end of the session to eventually settle at $2.953, up 3.9 cents on the day.
Still, that increase is on top of the 26 cents the Nymex prompt month gained for the period between Dec. 22 and 28. March prices were also up 26 cents during that time and climbed another 2.8 cents on Friday to settle at $2.906, while April sat Friday at $2.749.
The spread between March, when gas storage inventories are typically lowest at the end of winter, and April, the start of the traditional injection season, was less than a nickel earlier in the week as concerns about a storage overhang consumed the market. That was then.
The double-digit price increases were also seen in the summer 2018 strip as traders are now facing the realization that storage inventories will end the season far more depleted than earlier thought. Nymex summer 2018 prices rose 13 cents from Dec. 22 to 28 to reach $2.76, while the winter 2018-2019 strip rose a dime to $2.98. The calendar 2019 strip was up 4 cents to $2.81.
Northeast, Midwest Put Up Stout Gains As Temps Plunge
With some of the lowest temperatures and strongest demand in the Northeast, it should come as no surprise that markets in the region posted the most substantial increases in the country.
Transco zone 6-New York February forward prices shot up 87 cents from Dec. 22 to 28 to reach $6.837, March forwards jumped 29 cents to $3.865, summer 2018 rose 13 cents to $2.55 and the winter 2018-2019 strip climbed 18 cents to $4.74, according to Forward Look.
At Texas Eastern M3, February forward prices were up 99 cents during that time to $5.322, March was up 43 cents to $3.126, the summer 2018 was up 13 cents to $2.33 and the winter 2018-2019 was up 28 cents to $3.84.
The strength comes as Genscape shows Appalachia demand averaging 20.40 Bcf/d during the first week of January, up from the recent seven-day average of 17.81 Bcf/d. Demand is then expected to fall back to an average 16.17b Bcf/d the following week
Southeast/Mid-Atlantic demand is projected to average just shy of 21 Bcf/d for the first week of January, up from the recent seven-day average of 18.04 Bcf/d. The following week is expected to see demand average 17.242 Bcf/d.
In New England, Algonquin Gas Transmission City-gates February forward prices climbed 75 cents from Dec. 22 to 28 to reach $9.878, March moved up 46 cents to $5.722, summer 2018 rose 9 cents to $7.06 and the winter 2018-2019 shot up 44 cents to $7.06.
Genscape shows New England demand averaging 3.916 Bcf/d for the week, up from the recent seven-day average of 3.62 Bcf/d. Demand is then projected to slide to 3.376 Bcf/d for the second week of January.
Even Midwest markets posted some considerable gains this week as spot prices rose to the highest levels on record. At Northern Natural Ventura, February forward prices tacked on 56 cents to reach $3.336, March rose 38 cents to $2.822, summer 2018 climbed 14 cents to $2.55 and the winter 2018-2019 strip gained a dime to reach $3.00, Forward Look shows.
Northern Border Ventura February was up 60 cents to $3.368, March was up 40 cents to $2.832, summer 2018 was up 12 cents to $2.35 and the winter 2018-2019 was up 15 cents to $2.94.
Genscape shows regional demand surging to an average 5.514 Bcf/d for the week, up from the recent seven-day average of 3.78 Bcf/d, and then falling to an average 4.086 Bcf/d for the following week.
Canadian markets also posted significant gains during the week as bitter weather combined with oilsands production to drive up demand across the country. Dawn February forward prices shot up 52 cents from Dec. 22 to 28 to reach $3.407, while March jumped 46 cents to $3.288. Smaller increases were seen further out the curve, with the summer 2018 rising 13 cents to $2.56 and the winter 2018-2019 edging up 10 cents to $2.90.
At AECO, February climbed 19 cents during that time to $1.658, as did March, which hit $1.459. Single-digit increases were seen at the back of the curve, with the summer 2018 strip climbing to $1.11 and the winter 2018-2019 moving up to $1.60, according to Forward Look.
Genscape shows a similar demand picture for Canada, with demand softening as the market heads into the second week of the new year.
© 2024 Natural Gas Intelligence. All rights reserved.
ISSN © 1532-1231 |