NGI Weekly Gas Price Index | Markets | NGI All News Access
Wintry Northeast Lifts NatGas Spot Prices in Otherwise Bearish Week
Outside of wintry conditions boosting heating demand along the East Coast, it was a bearish week for natural gas, a fact reflected in weekly spot gas prices. Most regions finished 10-20 cents in the red, but big gains in the Northeast helped lift the NGI Weekly Spot Gas Average 7 cents to $2.96/MMBtu.
In the Northeast, where several systems declared operational flow orders during the week due to high demand, Algonquin Citygate led the way, jumping $3.77 to average $8.02. Tennessee Zone 6 200L wasn’t far behind, adding $3.33 for the week to $8.57. Transco Zone 6 New York gained 99 cents to $4.43.
A little further south, Transco Zone 5 also enjoyed a weather-driven bump, adding 16 cents to average $3.60.
Meanwhile, also in the Southeast region, Cove Point notched a $1.39 increase to $4.27. This week, a liquefied natural gas (LNG) tanker was spotted approaching Dominion’s new export facility at Cove Point and was expected to dock there Thursday to assist with the commissioning process, according to analysts and three websites that track the movement and position of seafaring vessels.
Out West, prices at the constrained SoCal Citygate softened a bit week/week after recording a few large day/day drops, including a new two-week low for day-ahead prices. SoCal Citygate finished 91 cents lower at $5.07.
Earlier in the week, the California Public Utilities Commission (CPUC) issued a final supplemental report on winter reliability that loosened the restrictions on how much gas utility Southern California Gas (SoCalGas) may withdraw from Aliso Canyon.
CPUC said SoCalGas may now keep stocks at Aliso — the site of a leak in 2015 that drew public scrutiny and shut down the facility for months — within a range of 0 Bcf to 24.6 Bcf, versus a previous range of 14.8 Bcf to 23.6 Bcf.
Most other points dropped around 15 cents week/week, mirroring the week/week decline in futures.
The January contract closed out the week by settling at $2.612 Friday, down from $2.772 the week before. The week’s downmove saw the prompt-month break below long-standing support in the $2.75 area, and a number of analysts looked to production growth — moreso than a lack of cold — to explain the selling.
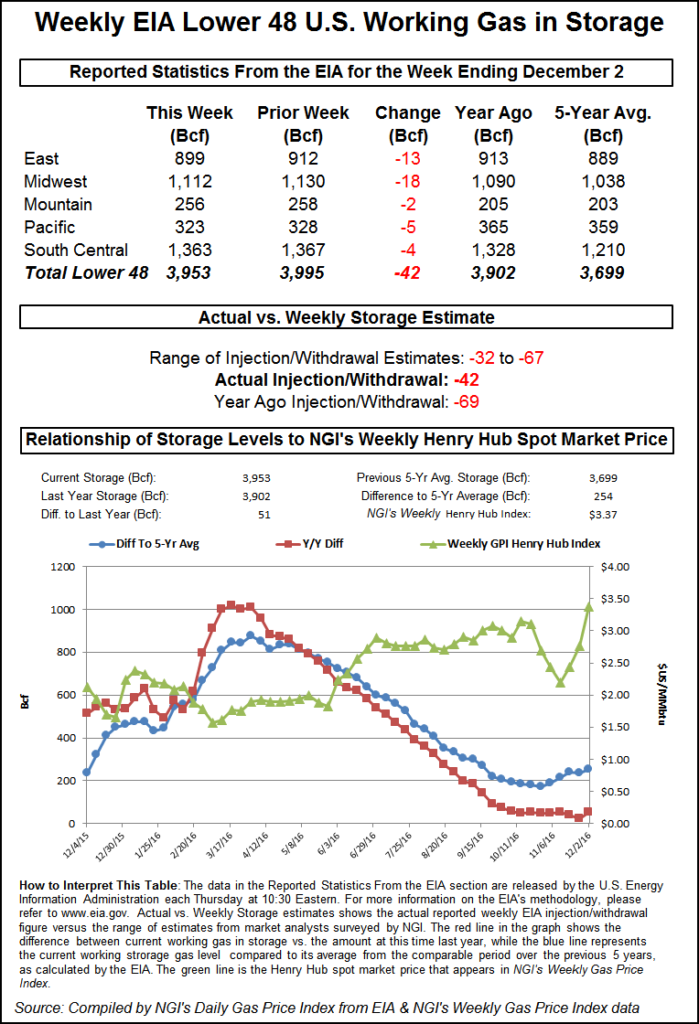
The Energy Information Administration (EIA) reported a net withdrawal from natural gas storage Thursday that was slightly bullish to market expectations but not enough to break the bear’s grip on the market.
After reporting a rare net injection last week, EIA reported a 69 Bcf withdrawal from U.S. gas stocks for the week ended Dec. 8, a slightly larger pull than what the market had been expecting.
In the minutes immediately following EIA’s 10:30 a.m. EDT report, the January contract dipped lower, trading as low $2.656 at 10:40 a.m. By 11 a.m. EDT, January was trading around $2.670-2.680, down from Wednesday’s settlement of $2.715.
Traders and analysts had been looking for a withdrawal slightly smaller than the actual figure.
A Reuters survey was on average calling for EIA to report a 60 Bcf net withdrawal from U.S. gas stocks for the week ended Dec. 8. Responses ranged from -49 Bcf to -95 Bcf. Last year, 132 Bcf was withdrawn, and the five-year average is a withdrawal of 78 Bcf.
Stephen Smith Energy Associates revised its estimate Tuesday to a 64 Bcf withdrawal for the week ended Dec. 7 after earlier calling for a 60 Bcf withdrawal. Kyle Cooper of ION Energy predicted a 61 Bcf withdrawal. PointLogic Energy was calling for a 57 Bcf withdrawal.
Total working gas in underground storage as of Dec. 8 was 3,626 Bcf, versus 3,827 Bcf a year ago and a five-year average 3,653 Bcf. This week, the deficit to the five-year average narrowed by 9 Bcf to -27 Bcf. The deficit to year-ago stocks decreased week/week from -264 Bcf to -201 Bcf, EIA historical data show.
Bespoke Weather Services said the number “shows a gradual tightening in the natural gas market at these lower price levels. Yet the reaction is not especially bullish” since “the number fell generally within expectations.
“We see it as confirming gradual tightening within the market and marginally decreasing downside,” the firm said. “It may increase support around the $2.65 level, but weather must improve again if prices are going to break back above the $2.75 level.”
By region, the largest week/week withdrawal came from the Midwest, which posted a net 25 Bcf decline. The East saw a 13 Bcf withdrawal, while the Mountain and Pacific regions each posted an 8 Bcf pull.
The South Central region, after recording a 21 Bcf injection the previous week, finished at -15 Bcf for the current report week, all from nonsalt.
Natural gas futures fell again Friday after taking out support earlier in the week, with some wintry conditions predicted for late December not enough to inspire a rally. In the spot market, forecast demand declines meant tempered interest in three-day deals, and the NGINational Spot Gas Average fell 12 cents to $2.73/MMBtu.
The January contract settled 7.2 cents lower at $2.612, a characteristic end to another bearish week for natural gas. February settled 6.9 cents lower at $2.635.
Bespoke Weather Services said it continued to view the recent declines as balance-driven, noting that “the entire strip sold off almost equally” Friday. “Our sentiment into the weekend remains slightly bullish because of the potential for sizable heating demand additions in the eight- to 16-day forecast.
“Models have gradually been decreasing the southeastern ridge that was shown at the beginning of the week,” a development favorable to additional cold moving into the East in late December.
The long-range forecast trended colder through Friday, “in line with expectations,” said Bespoke. “What has not been in line with expectations has been the ensuing natural gas price action response, as prices continued to follow the trend of the last few weeks of stabilizing (but not rallying) on colder trends and then selling off on the first sign of warmer weather.”
In a Friday afternoon update to clients, NatGasWeather.com said the most recent run in the European model “wasn’t as cold” as it was Thursday night “but was still colder than previous days. A relatively cold solution with periods of frigid air across the northern and central U.S.” late in the week ahead “and beyond, but still a bit too warm over the Southeast.
“Tough to know how the models will trend over the weekend with so many flip-flops…on the strength of the eastern U.S. ridge Dec. 23-29,” NatGasWeather said. “Much larger than normal draws on supplies versus the five-year average are still expected two of the next three weeks, making selling this week appear to be primarily driven by record high production.”
Asked about the recent sell-off in futures, Powerhouse’s Elaine Levin, president of the Washington, DC-based risk management firm, said, “Ultimately, something changed” to cause the market to break below a long-standing trading range of around $2.75-3.20. “Buying this market around $2.75-2.80 would have been a rewarding trade going back to the summer.”
Analysts with Tudor, Pickering, Holt & Co. said Friday the recent price action was “a bit of a head-scratcher, especially as the Climate Prediction Center (CPC) increased the probability of La Nina lasting through the winter from 65-70% to more than 80% Thursday.”
The CPC said in its updated outlook that “La Nina is anticipated to affect temperature and precipitation across the United States during the upcoming months…The outlooks generally favor above-average temperatures and below-median precipitation across the southern tier of the United States, and below-average temperatures and above-median precipitation across the northern tier of the United States.”
PointLogic Energy said in a note to clients Lower 48 production for the week ended Friday averaged 76.1 Bcf/d, roughly flat week/week. That’s up from a little above 70 Bcf/d in January, PointLogic data indicate. According to the analytics firm, the Northeast showed the largest week/week gain by region at 0.7 Bcf/d, including a 0.3 Bcf/d gain in the Marcellus-West Virginia Wet area.
With new takeaway capacity set to come online, the recent growth in Appalachian output looks likely to continue. On Friday, the Federal Energy Regulatory Commission authorized Rover Pipeline LLC to begin service on three eastern Ohio supply laterals and associated compression, clearing the way for the pipeline to tie additional receipt points to its Mainline A. Rover has been flowing around 500 MMcf/d east-to-west recently but is designed to eventually transport up to 3.25 Bcf/d.
Analysts with Goldman Sachs said in a report released a few days ago that they see “Henry Hub upside this winter, but as new Appalachian capacity comes online Henry Hub prices should moderate while local Appalachian prices should strengthen. We see gas storage levels poised to move below normal through the first half of 2018, which provides an attractive near-term setup.
“However, we expect 15 Bcf/d of pipeline takeaway to come online to take gas out of Appalachia by 2019,” Goldman analysts said. “We do not expect production to grow by this amount immediately…We maintain our $3/MMBtu Henry Hub forecast for 2018. We see local Appalachian differentials moving towards $0.25/MMBtu below Henry Hub to keep Appalachian pipes below full utilization.”
In the spot market Friday, expectations for demand to fall by Monday (Dec. 18) proved enough to sink prices at a number of East Coast points. After peaking at 95.3 Bcf/d Thursday, PointLogic forecast Lower 48 demand to fall to 75 Bcf/d by Monday, analyst Rishi Iyengar said.
“Our weather forecast continues to predict warmer population-weighted temperatures for the Lower 48” heading into the weekend, “rising from 40 degrees Friday to 48.9 degrees on Monday,” Iyengar said.
Transco Zone 6 New York plummeted $1.85 to average $3.22, while Transco Zone 5 gave up 25 cents to $2.74. Transco said it would be lifting an operational flow order (OFO) starting Saturday that had been in effect for Zones 5 and 6 because of high demand.
“Circumstances leading to the issuance of the OFO are expected to improve; however, Transco has limited flexibility to manage large imbalance swings and strongly encourages all shippers to manage their system requirements to ensure a concurrent balance of receipts and deliveries daily,” the pipeline told shippers Friday.
In Appalachia, Dominion South fell 7 cents to $2.07, while Columbia Gas dropped 9 cents to $2.46.
Genscape Inc. was forecasting demand in the Appalachia region, including New York and New Jersey, to decrease from 18.2 Bcf Thursday (Dec. 14) to just under 14 Bcf by Monday.
In New England, Genscape models showed demand declining from 4.05 Bcf Thursday to just above 3 Bcf by Monday. Iroquois Zone 1 dropped 83 cents to $3.64, while Iroquois Zone 2 fell $1.54 to $3.65. The constrained Algonquin Citygate, moved the other way, adding 20 cents to $7.63.
Out West, SoCal Citygate recorded another day/day jump after setting new two-week lows earlier in the week. Prices there climbed 85 cents to $4.71.
Southern California Gas (SoCalGas), dealing with ongoing import constraints, reported withdrawing 242,000 Dth from storage Thursday to go with nearly 2.57 million Dth of receipts. SoCalGas was forecasting total system demand to exceed 3 million Dth on Monday, with a forecast storage withdrawal of 485,852 Dth.
© 2024 Natural Gas Intelligence. All rights reserved.
ISSN © 2577-9877 | ISSN © 1532-1258 |