Markets | NGI All News Access | NGI The Weekly Gas Market Report
Price Doldrums, Production Slump Weigh on 2Q2017 NatGas Marketers
The nearly two dozen leading natural gas marketers participating in NGI‘s 2Q2017 Top North American Gas Marketers Ranking recorded a 5% decline compared with 2Q2016, and there seems no lack of reasons why.
The first may be a lack of price volatility as 2017 has to date been in the doldrums for natural gas prices. Prompt Henry Hub futures prices have averaged $3.06/MMBtu this year, considerably higher than through the same portion of 2016, when prices averaged $2.27/MMBtu. But NGI analysts found that the standard deviation in the first eight months of 2016 was 37 cents, compared with just 18 cents so far this year.
“Another reason is production is down year-over-year through the first half of the year,” said NGI’s Patrick Rau, director of Strategy and Commodity Research. “U.S. dry gas production was down 3.1% during the first five months of 2017 versus January through May of 2016, although production versus last year has been picking up lately. February 2017 was down 3.9% year-over-year, but those declines have slowed to 2.4%, 1.6%, and 0.9% in each of the following months.
“Moreover, most U.S. exploration and production companies either reaffirmed their production guidance for 2017, or took it up a notch. That could change if natural gas prices fall through the floor, of course, but for now, production volumes look to carry some positive momentum into the second half of 2017, everything else being equal.”
U.S. dry natural gas production increased in the final month of 2Q2017 compared with June 2016, breaking a series of year/year declines dating back to February 2016, according to the Energy Information Administration (EIA). It was the largest year/year increase in any month since November 2015.
But, with Hurricane Harvey’s impact on Houston and the Gulf Coast still being measured, everything else may not be equal. Total 3Q2017 volumes could be hampered by Harvey-related demand or supply destruction. By last Monday (Aug. 28), with Harvey still hovering near Houston, the storm had already curtailed about 1 Bcf/d from U.S. natural gas exports to Mexico, according to Genscape Inc. Harvey’s impact has led to a bigger loss of U.S. onshore supply — from the Eagle Ford Shale — than historically had been the case, according to analysts.
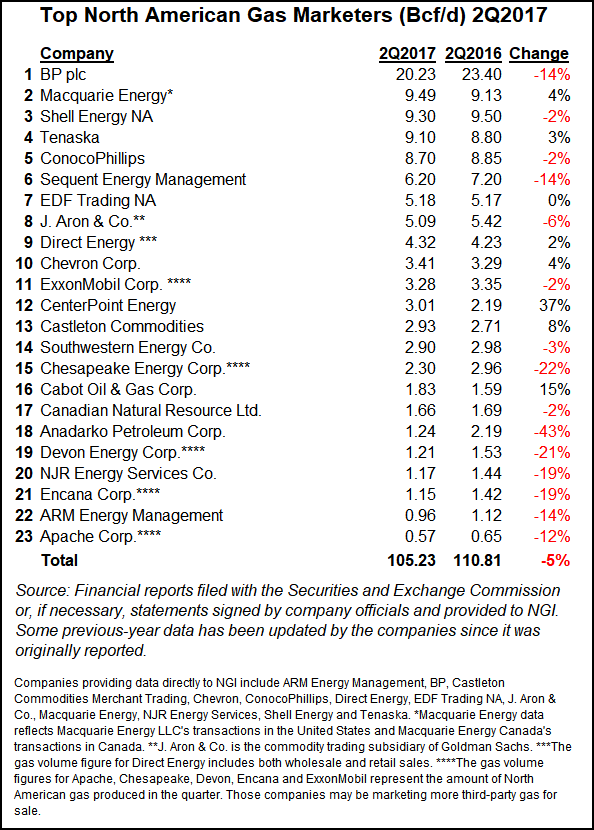
NGI’s quarterly snapshot of leading gas marketers reported combined sales transactions of 105.23 Bcf/d in 2Q2017, a 5.58 Bcf/d decline year/year from the 110.81 Bcf/d transacted during 2Q2016.* Following two quarters of 7% increases in 2016, marketers have reported three consecutive quarters of declines.
BP plc reported 20.23 Bcf/d in 2Q2017, enough to hold onto its perennial No. 1 position by a wide margin, but still a 3.17 Bcf/d (14%) decline compared with 23.40 Bcf/d in 2Q2016. The slowdown came even as the supermajor continues its shift from oil to natural gas.
Macquarie Energy leapfrogged from No. 5 to No. 2, reporting 9.49 Bcf/d, a 4% increase compared with 9.13 Bcf/d in 2Q2016. Macquarie’s total was boosted by the company’s purchase in June of Cargill’s North American Power and Gas trading business. Macquarie was No. 5 in NGI‘s recent analysis of 2016 Form 552 buyer and seller filings with the Federal Energy Regulatory Commission; Cargill was No. 47 in NGI‘s analysis of 2015 Form 552 filings, buying and selling 669.8 Tbtu.
The NGI survey ranks marketers on sales transactions only. FERC’s Form 552 tallies both purchases and sales.
At No. 3, Shell Energy NA reported 9.30 Bcf/d, a 2% decline compared with 9.50 Bcf/d in 2Q2016. Shell agreed in June to buy MP2 Energy LLC, which manages power plants and delivers retail power to end-use customers. With the purchase, Shell, which manages a retail energy business targeting large commercial and industrial customers on the West Coast, plans to expand operations in Texas and through the eastern United States.
No. 4 Tenaska reported 9.10 Bcf/d in 2Q2017, a 3% increase from 8.80 Bcf/d in 2Q2016. Omaha-based Tenaska has been a solid performer in recent NGI surveys, posting a 14% increase for the full year 2016 even as the rest of the field stayed nearly flat.
“Tenaska Marketing Ventures [TMV] continued to see a lot of activity in the market during the second quarter and an increased demand for the supply chain management services we provide our customers,” said Mark Whitt, TMV’s executive vice president trading & marketing, West Region. “Our volumes increased in the second quarter by over 3% as we assisted customers in moving supply through new and existing infrastructure to the areas of increased demand, especially export and power markets.
“TMV is optimistic that there will be continued growth in the market for the remainder of the year and into 2018, especially in the export sector, both LNG and Mexico. Additional areas of growth will be in the industrial and power sectors as prices are forecasted to remain relatively low. TMV has built its operations to be scalable and has invested in its physical platform (transportation and storage) throughout North America to help our customers manage this future growth.”
Other Top 10 companies reporting increases were Direct Energy (4.32 Bcf/d, up 2% from 4.23 Bcf/d) and Chevron Corp. (3.41 Bcf/d, up 4% from 3.29 Bcf/d). EDF Trading NA was nearly unchanged from a year ago at 5.18 Bcf/d.
Highlights of the 2Q2017 survey include a 37% increase for CenterPoint Energy (3.01 Bcf/d, compared with 2.19 Bcf/d in 1Q2016)*, an 8% increase for Castleton Commodities (2.93 Bcf/d, compared with 2.71 Bcf/d in 1Q2016) and a 15% increase for Cabot Oil & Gas Corp. (1.83 Bcf/d, compared with 1.59 Bcf/d in 1Q2016).
Natural gas trading volumes soared 4.4% last year compared with 2015, according to NGI‘s review of the latest annual FERC 552 data.
*Correction: In the original article CenterPoint Energy’s 2Q2016 and 2Q2017 volumes were incorrectly stated. The correct volumes are 3.01 Bcf/d in 2Q2017 and 2.19 Bcf/d in 2Q2016, representing a 37% increase. The story and rankings chart have been updated. NGI regrets the error.
© 2024 Natural Gas Intelligence. All rights reserved.
ISSN © 1532-1231 | ISSN © 2577-9877 | ISSN © 1532-1266 |