E&P | NGI All News Access | NGI The Weekly Gas Market Report
Top 50 U.S. E&Ps Reinvesting at ‘Robust’ Levels, Despite Stagnant Prices
The 50 largest U.S. explorers demonstrated their commitment to resource acquisition and development last year despite low commodity prices, with plowback percentages that exceeded the five-year average of 132%, according to a new reserves study.
In its 10th annual survey of the domestic exploration and production (E&P) sector, Ernst & Young LLP (EY) researchers did a deep dive on end-of-year oil and natural gas reserve disclosures for the top domestic operators, both integrated and independents.
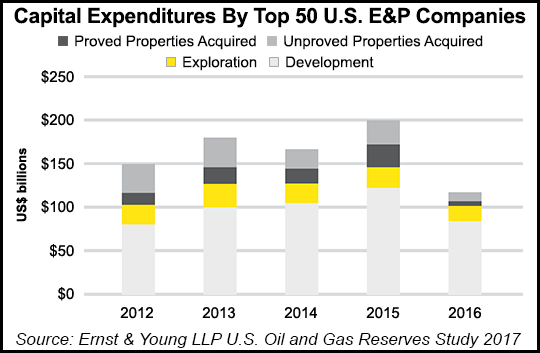
Total capital expenditures (capex) for the group came in last year at $85.7 billion, 27% less capex than in 2015 and 57% below 2014 levels. Similarly, revenue fell to $103 billion, off 21% from 2015 and 53% from 2014.
“Capital expenditures in 2016 were by far the lowest of the five-year study period, and looking back, were comparable to the roughly $75 billion we reported in prior studies for 2009 in the aftermath of the 2008 financial crisis,” said EY’s Herb Listen, a partner in U.S. assurance oil & gas. “However, the level of reinvestment by E&P operators — measured in part by the plowback percentage — remained robust.”
Plowback percentage is total capex as a percentage of revenue minus production costs.
Because a significant portion of total U.S. reserves are held by the top 50 producers, the results generally should represent the domestic sector as a whole, according to EY. The study companies were classified as either integrated companies, large independents or independents. Large independents are defined as having more than 1 billion boe of reserves.

Among the peer groups, “independents led the charge with the highest plowback percentage, 186%, while large independents and integrateds posted a rate of 149% and 141%, respectively,” Listen said.
Invested capital also went further in 2016 than in previous years because of “efficiency improvements and cost reductions across the sector.”
The capex decline last year among the E&Ps reviewed was evident in the distinction between exploration and development spend. Exploration spend fell 35% year/year in 2016 while development spend declined 52%. Drilling activity demonstrated similar trend lines from 2015, as the number of exploratory net wells drilled fell 15%, while development net wells slumped 51%.
Meanwhile, the E&P acquisition activity rebounded last year from 2015, with both unproved and proved property acquisition costs increasing. Unproved costs surged 119% to $23.2 billion and proved costs doubled to $12.0 billion. In fact, eight of the 50 E&Ps last year accounted for total proved and unproved acquisition spending above $2 billion.
“The deal market certainly warmed up in the second half of 2016 with unproved properties accounting for nearly two-thirds of acquisition spending,” said EY’s Mitch Fane, a partner in U.S. Oil & Gas Transaction Advisory Services. “Transaction volumes increased as a result of companies emerging from bankruptcies and looking to rationalize their portfolios. Likewise, we expect increased transaction volume in 2017 due to a concerted portfolio shift to single basin companies and hi-grading of existing properties.”
The 50 E&Ps studied reported total losses in 2016 of $34.5 billion net, a marked improvement from $100.8 billion net losses in 2015. The 2015 losses primarily resulted from “staggering impairments” that reached $121 billion; in 2016 impairments for the group totaled $20 billion.
Offsetting the lower impairments last year, a 3% decrease for combined oil and gas production and lower commodity prices caused revenues to decline 21% from $130.3 billion in 2015 to $103.0 billion in 2016. These reductions followed a 41% decline in 2015 from 2014.
End-of-year natural gas reserves for the E&Ps fell only 1% year/year in 2016 to 148.0 Tcf, versus a 21% decline in 2015 from 2014 — mostly on downward reserve revisions. Last year, gas extensions and discoveries were relatively flat at 18.8 Tcf compared with 2015, largely offsetting production and smaller downward reserve revisions.
Meanwhile, oil reserves for the E&Ps reviewed declined a modest 2% from 2015 as extensions and discoveries more than offset production, while substantially lower downward revisions were recorded. Oil reserves totaled 23.9 billion bbl in 2016, up from 24.4 billion bbl in 2015.
“In the face of lower prices, decreased revenues and profits and a fundamental change in the supply market, U.S. producers remain a potent force in the global picture,” Listen said. “Now that the market has increasingly come to terms with the new normal of low prices, we expect U.S. producers to focus on both optimizing their portfolios — through acreage swaps, sales of noncore assets among struggling producers and strategic purchases — while also continuing operational improvements to make their capital expenditures even more productive.”
© 2024 Natural Gas Intelligence. All rights reserved.
ISSN © 2577-9877 | ISSN © 1532-1266 | ISSN © 2158-8023 |