Markets | NGI All News Access | NGI The Weekly Gas Market Report
For Natural Gas Prices, North America No Longer an Island, Says Barclays
Forecasting U.S. natural gas prices is becoming more complex as contributions from global exports revamp the domestic supply/demand balance, according to an analysis by Barclays Capital.
“Gone are the days when U.S. natural gas watchers can simply follow their own North American gas island,” wrote Barclays analyst Nicholas Potter.
According to a report issued in March by the Department of Energy, the United States since February 2016 had exported 107 liquefied natural gas (LNG) cargos. Global LNG trade in 2016 reached a record 258 million metric tons, which was about 5% higher year/year, according to the International Gas Union.
“The shipments have sent 330 Bcf of Henry Hub-linked gas into 20 different countries,” Potter said. “The latest list of U.S. LNG projects under construction includes five projects and 13 liquefaction trains. Combined, these will, in aggregate, provide the U.S. with the option of exporting as much as 62 million metric tons/year (mmty) by 2020 (8.2 Bcf/d).”
Because exports are contributing a bigger portion to the overall supply/demand balance, understanding their role in the global market helps to reinforce a view on the direction of U.S. gas prices, Potter said.
“Given the way that U.S. LNG contracts are structured, offtakers have the option of not lifting cargoes, an event that would be bearish for U.S. prices. If U.S. LNG arbitrage economics are not attractive, the gas will be left in the U.S. system. This will put downward pressure on prices until the arbitrage window is once again open with international markets.”
As export volumes increase over the coming years, the U.S. short run marginal cost (SRMC) LNG “should start to set a new long-term ceiling for U.S. gas prices likely occurring by as soon as late 2018-early 2019,” according to Potter.
European gas prices likely will gauge the competitiveness of U.S. exports, he said. Global LNG volumes likely grow by about 40% by 2020, mostly because of capacity buildout in the United States, Australia and Russia, he said.
“Given the finite amounts of incremental demand in the premium markets of Asia, the Middle East and South America, increasing volumes of LNG will likely be imported into Europe, especially Northwest Europe, given the region’s liquidity relative to other global gas markets (the UK, Belgium and the Netherlands).
“As long as European prices remain above the SRMC of U.S. LNG, this should bode well for utilization levels at U.S. export facilities and, thus, be bullish for U.S. natural gas prices.”
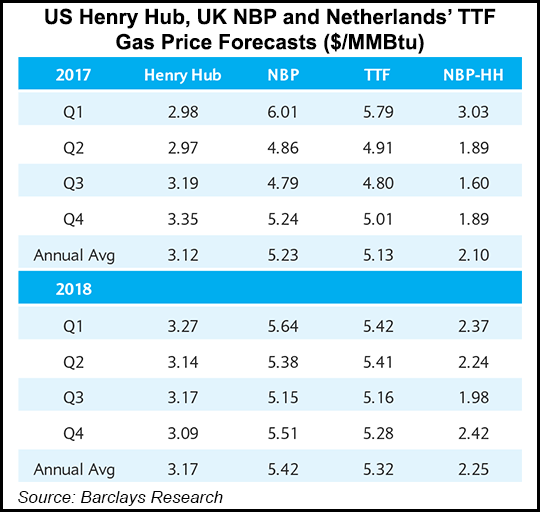
Barclays price forecasts point to U.S. SRMC LNG costs “continuing to be below Northwest European (NWE) prices markers UK National Balancing Point and Dutch Title Transfer Facility for 2017 and 2018,” Potter said.
Barclays defines U.S. SRMC LNG as Henry Hub 115% plus shipping plus regas. “We have assumed 45 cents/MMBtu shipping to NWE and a 30 cent/MMBtu regas charge,” Potter said.
Barclays estimated that by the end of 2018, operational U.S. LNG projects should include Sabine Pass (four trains), Dominion Cove Point (one train), Freeport LNG (one train), and Cameron LNG (two trains).
“We are estimating that U.S. LNG exports average 2.1 Bcf/d in 2017 and 3.2 Bcf/d in 2018, compared with just 600 MMcf/d in 2016,” Potter said. “The NWE-U.S. SRMC spread will come under the most pressure during the summer when NWE prices are typically at their lowest and U.S. prices have found strength on the back of higher gas usage in the power sector.”
The spread is expected to decline to only 37 cents/MMBtu in 3Q2017 and reach its annual low in 3Q218. The window for long-run marginal cost LNG (LRMC), which includes the fixed commodity charge, “will remain closed into Europe during 2017-2018, according to our forecasts,” Potter said.
According to Barclays, the biggest risks to the NWE-U.S. SRMC spread are from a collapse in oil prices or a spike in Henry Hub prices.
“All else equal, a 25% lower Brent price compared with our current forecast results in the NBP-SRMC U.S. LNG arbitrage (arb) closing, while, similarly, a 30% higher Henry Hub cash price compared with our current forecast would also close the arb,” Potter said.
To date, all the LNG exports are not leading to Europe, he noted. Even though LNG production increased 7.5% in 2016, the gas deluge was stalled from entering European markets following a cold winter in East Asia, project outages and “growing niche market demand.” Last year’s European gas imports mostly were flat year/year in 2016, with imports into NWE down about 25% through May.
© 2024 Natural Gas Intelligence. All rights reserved.
ISSN © 1532-1231 | ISSN © 2577-9877 | ISSN © 1532-1266 |