Markets | NGI All News Access | NGI The Weekly Gas Market Report
Natural Gas Trading Volumes Rose 4.4% in 2016 from 2015, Based on NGI Analysis of FERC Form 552 Data
Natural gas trading volumes increased 4.4% last year compared with 2015, an even greater increase than the 3.9% year/year gain posted in 2015, according to an analysis by Natural Gas Intelligence (NGI) of 2016 Form 552 buyer and seller filings with FERC.
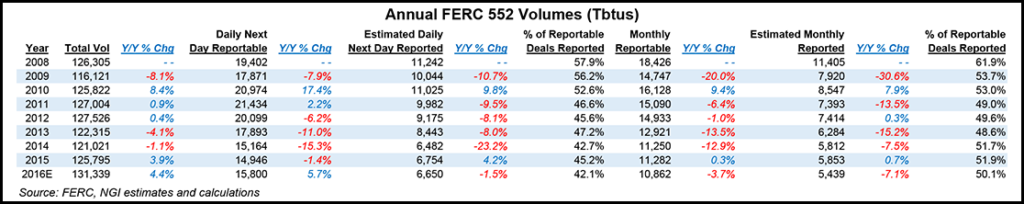
The estimated 2016 total volume was 131,339 TBtu, compared with 125,795 TBtu in 2015.
Day-ahead “reportable” transactions were up 5.7% compared with 2015, although the amount of those that were reported directly to price reporting agencies (PRA) like NGI were down 1.5% year/year. Declines were more acute in the Bidweek market where total reportable and actually reported deals fell 3.7% and 7.1% year/year, respectively.
The volumes do not include transactions conducted on Intercontinental Exchange (ICE) that were reported directly to NGI by that exchange. NGI is currently the only PRA that includes ICE data in its indexes (and has since 2008). Data are as of June 2, and include revisions from previous years.
Several companies have yet to report their 2016 trading data, which could lower the year/year declines. And a decline in U.S. natural gas production – the first such decline in more than a decade – is creating an atypical drag on reported volumes, according to Patrick Rau, NGI’s director of strategy and research.
“Producers as a whole tend to be significant contributors to PRAs, and there was simply less production to report last year,” Rau said.

However, the U.S. gas-directed rig count has more than doubled since the cyclical low in early June 2016, and associated gas production, from the Permian Basin and Eagle Ford Shale in particular, should continue to move higher in the months ahead, Rau said.
BP plc and Royal Dutch Shell plc remained the two most active companies in 2016, though both had lower volumes compared with the previous year. BP reported 8,697 TBtu in 2016, down 0.9% compared with 2015, and Shell 5,642 TBtu, down 14.0% compared with 2015.
Tenaska strengthened its hold on the No. 3 position, with volumes reaching 5,351 TBtu, up 21.1% compared with 2015. Southern Co. moved into the No. 4 spot (5,004 TBtu in 2016 from 699 TBtu in 2015), thanks to its acquisition of AGL Resources, which had been No. 5 in 2015. Southern was the biggest mover in the Top 50, jumping 40 positions.
Macquarie dropped one position to No. 5 with 4,402 TBtu. ConocoPhillips (3,841 TBtu) and Exelon (2,710 TBtu) retained their respective No. 6 and No. 7 slots, while CenterPoint’s (2,385 TBtu) late-2016 acquisition of Atmos Energy Marketing propelled them to the No. 8 spot on a pro-forma basis, up from its No. 16 stand-alone ranking in 2015.

Rounding out the Top 10 were Goldman Sachs (2,342 TBtu) at No. 9, and EDF Group (2,272 TBtu) at No. 10.
Five companies entered the Top 50 in 2016: Antero Resources (No. 35), Emera Inc. (No. 43), Vitol (No. 48), Mitsui (No. 49), and Texla Energy Management (No. 50). Emera and Vitol both climbed 37 spots compared with 2015, while Mercuria and Antero were up 26 and 22 places, respectively.
Falling out of the Top 50 were AGL Resources (No. 5 in 2015), Atmos Energy (No. 33 in 2015), JP Morgan (No. 45 in 2015), BNP Paribas (No. 48 in 2015), and EOG Resources Inc. (No. 50 in 2015).
Noble Group and Occidental Petroleum Corp. each posted double-digit declines, and Pacific Summit dropped nine slots. Avangrid, Devon Energy Corp. and DCP Midstream LLC all fell eight notches compared with 2015.
In its analysis, NGI pooled information so that each company’s total includes data from subsidiaries to provide a more complete picture of parent company activity. NGI‘s analysis covers data taken directly from a spreadsheet located on the Federal Energy Regulatory Commission’s website and from individual company filings.
An NGI survey of leading natural gas marketers in North America earlier this year found a 1% increase for full-year 2016 compared to 2015 sales. But marketers reported a 2% decline in 1Q2017 compared with 1Q2016.
The NGI survey ranks marketers on sales transactions only. FERC, in its Form 552 tallies both purchases and sales.
© 2024 Natural Gas Intelligence. All rights reserved.
ISSN © 1532-1231 | ISSN © 2577-9877 | ISSN © 1532-1266 |