Markets | NGI The Weekly Gas Market Report
Dramatic Declines Hit NatGas Forwards as May Expected to Close Out on Cool Side
Natural gas forward prices for June plunged by an average 24 cents between May 12 and 18 as forecasts for cooler weather for the rest of May took center stage, according to NGI Forward Look.
The dramatic declines started at the top of the week amid some profit-taking following the previous week’s rally. But the steady decline progressed even further on Tuesday when weather models converged in calling for below-normal temperatures from May 24 to 30 for the eastern two-thirds of the country, analysts with Mobius Risk Group noted after market close on Tuesday.
“A commensurate decline in CDDs [cooling degree days] will be magnified by increasing nuclear power generation, and the result could cause a bearish shift in power burn observations. However, with a relatively long lead time, the weather forecast is certainly subject to change,” Houston-based Mobius said.
Indeed, forecaster NatGasWeather said the weather data is struggling to resolve when cooling will finally exit the east-central United States, with the European weather model still rather cool to start June compared to the global model, which hints of hotter temperatures building.
“Bigger picture, the peak of the shoulder season is two EIA [(U.S.) Energy Information Administration] reports out, with none of the coming series expected to be close to 100 Bcf. As such, surpluses will continue to decline at a steady pace,” NatGasWeather said.
The issue of whether the decline in the storage surplus occurs fast enough remains, the forecaster said. The onus is clearly on hotter patterns gaining traction, and while there are some hints of it developing in early June, the data has plenty of work to do, it added.
EIA on Thursday reported a 68 Bcf build in storage inventories for the week ending May 12, 7 Bcf higher than market consensus but on the high end of wider estimates. During the same week last year, 71 Bcf was injected, and the five-year average stands at 87 Bcf. Inventories are now at 2,369 Bcf, 375 Bcf below year-ago levels and 256 Bcf above the five-year average of 2,113 Bcf.
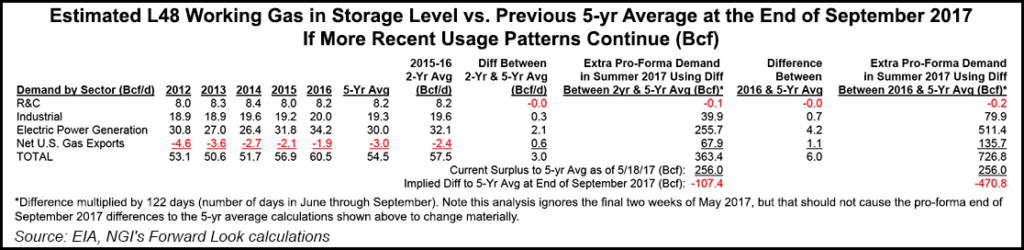
It is important to note that structural changes in the market during recent years have changed the way markets should consider historical comparisons, NGI’s Patrick Rau, director of strategy and research, said. A substantial increase in gas-fired generation, coupled with rising exports to both Mexico and in the form of liquefied natural gas (LNG), have ushered in a new era for the natural gas market.
For example, if this June-September, demand averages what it did the last two years during June-September, then that will create 3.0 Bcf/d of additional demand over the average of June-September during the last five years.
“3.0 Bcf/d x 122 days (in June-September) equals 363 Bcf (after rounding) of additional demand versus the five-year average. That means the current 256 Bcf surplus versus the five-year average would shrink to a 107 Bcf deficit by the end of September, everything else being equal,” Rau said.
If only 2016 demand is used versus the five-year average, then the deficit becomes 471 Bcf by the end of September. Using more current rates, and/or factoring in growth this summer, the deficit likely becomes even more pronounced, he said.
“Point being, comparing gas in storage to the five-year average is an outdated and misleading exercise, considering the U.S. is now providing de facto storage capacity to serve both Mexico and the rest of the world through LNG exports,” Rau said. “And that’s just going to grow as more LNG export capacity gets built. We’re at 2 Bcf/d or so now, going to 8 Bcf/d plus by the end of the decade.”
It also means production is really going to have to step up, he added. “If it doesn’t, perhaps the 2018 strip shouldn’t be in such backwardation,” he said. Indeed, the Nymex calendar year 2018 strip averaged $3.09 as of Thursday, compared to the June-December 2017 $3.33 average.
Production continues to hover around 70-71 Bcf/d, although gains are expected in the second half of the year. Some industry estimates have production growing more than 3 Bcf/d by year-end.
Rau said if gas-fired power demand is down year-over-year, then gas in storage versus the five-year average won’t be as negative. “But if historical rates continue this year, then we are in fact likely looking at a deficit to the five-year average coming out of September,” he said.
The steep losses seen in the prompt month extended throughout the remainder of the year, with only modest losses seen beyond 2017. As for Nymex futures, June tumbled 24 cents from May 12-18 to reach $3.18, July shed 22 cents to hit $3.28, the balance of summer (July-October) dropped 20 cents to $3.31 and the winter 2017-2018 fell 15 cents to $3.50.
Nationally, forward prices mirrored the declines in the Nymex, falling an average 24 cents for June, 22 cents for July, 20 cents for the balance of summer (July-October) and 15 cents for the upcoming winter, according to Forward Look.
Nymex futures were poised to recover some of the week’s losses on Friday as a technical bounce kept the prompt month in the black throughout most of the session. The front-month contract closed Friday’s regular session at $3.256, up 7.4 cents from Thursday’s finish.
Taking a closer look at the forwards markets, there were few strays as the bulk of the country kept pace with the Nymex. Across the border to the north, however, western Canadian markets found some comparative strength as demand in the region has surged to record levels.
AECO June forward prices fell 16 cents from May 12-18 to reach $2.15; this compares to the 24-cent U.S. average, according to Forward Look.
The comparative strength at AECO comes as demand is up substantially, almost exclusively due to increased oil sands production, according to data and analytics company Genscape Inc. Provincial demand is averaging a summer-to-date record high of 4,550 MMcf/d, coming in more than 500 MMcf/d greater than both last year and the prior three-year average. The gains are almost exclusively from increased demand for oilsands production as Alberta has more or less exited heating season.
In addition to new facilities having been brought online this year, last year’s oilsands output was suppressed due to the Alberta wildfires combined with a heavier-than-normal turnaround season. Genscape shows Alberta oilsands production in April 2017 came in about 230,000 b/d higher year-over-year, and May is expected to come in nearly 897,000 b/d higher.
This year-on-year increase translates to more than 600 MMcf/d of incremental gas demand. The Louisville, KY-based company expects the year/year gains to continue as turnarounds will be smaller than normal, new facilities will come online in 3Q2017, and (so far) wildfire concerns are lower than last year as the precipitation and temperature outlooks for Alberta appear normal.
But while AECO June prices did not fall as much as most other markets, outright gains are nonexistent since much of the demand is being met by an equally large increase in production, along with cuts to exports, Genscape said.
Alberta summer-to-date production is averaging 11,504 MMcf/d, the highest summer-to-date level in Genscape history (to 2008). Production is running nearly 200 MMcf/d higher than last year and about 600 MMcf/d above the prior three-year average.
“Part of the production gains have been driven by the crude-price runs earlier in the year. Seasonality is also a factor with this year’s breakup season running short,” Genscape said.
Canada’s spring breakup is the time of year when crews cannot access rig sites as the thawing muskeg turns to mud, Genscape explained. Breakup typically runs from April through May and results in closures of roads until they dry out. This year, breakup started early in March and has ended early in many producing areas.
AECO’s momentum has also been sapped by declines in Alberta exports. Exports are currently averaging a summer-to-date low of 6,258 MMcf/d, about 200 MMcf/d off last year’s pace and 600 MMcf/d behind the prior three-year summer-to-date average, according to Genscape.
Alberta exports to the western United States are being hampered by weak gas demand in the U.S. West amid a strong hydro and renewables season there. Exports to the U.S. Midwest have been limited by healthy storage inventories in the region, compounded by the sharp cut to flows on the Vector pipeline this month due to maintenance.
The rest of the AECO forward curve fell more in line with the U.S. markets, with July sliding 20 cents from May 12-18 to reach $2.12, the balance of summer (July-October) falling 20 cents to $2.15 and the winter 2017-2018 dropping 17 cents to $2.37, Forward Look data shows.
Meanwhile, in the Rockies, Opal June forward prices plunged 25.7 cents from May 12-18 to reach $2.746, while July fell 22 cents to $2.91, the balance of summer (July-October) dropped 20 cents to $2.93 and the winter 2017-2018 slid 14 cents to $3.18, according to Forward Look.
Opal is one of 26 new locations recently added to NGI’s Forward Look product. The recent additions are part of NGI’s continual efforts to enhance market visibility.
© 2024 Natural Gas Intelligence. All rights reserved.
ISSN © 1532-1231 | ISSN © 1532-1266 |