Markets | NGI All News Access | NGI Data
NatGas Cash Steady, Futures Rise As Traders Mull Higher Summer Power Burns
The watchword for Wednesday’s trading was steady for both physical and financial natural gas markets. In the physical market modest gains in the Northeast, Appalachia, the Rockies and California were able to counter softness in Louisiana, the Midwest and Midcontinent.
The NGI National Spot Gas Average was flat at $2.93. A steady next-day power market helped keep any rises in gas required for power generation in check, and traders noted little change in the picture expected to bring cooler readings to the Northeast. Futures traders don’t see any near-term factors capable of generating a meaningful price rally, but at the close June was up 3.3 cents to $3.228 and July was higher by 3.5 cents to $3.309. June crude oil recovered from its pummeling Tuesday and gained 16 cents to $47.82/bbl.
Analysts focused on recent power burn data see some indications that power usage this summer may be higher than what is currently anticipated. “Looking at power burns recently we noticed what appears to be sharp shift over the last week compared to earlier in the month,” said Jeff Richter, principal with Energy GPS, a Portland, OR-based energy and consulting firm.
“With warm temperatures across the East and South Central region an increase in cooling demand was to be expected. Digging a little deeper, there is a larger story to tell.” Energy GPS defines the net load as power demand minus wind/solar/hydro/nuclear across the entire Lower 48.
Richter notes a distinct difference between the last 5 days of power burns and the 30 days prior. Data reflecting the last five days are either well above or sitting near the top of the record sets, and “there is a day that is showing the highest net load in the period, which warranted the highest power burns over the course of the month of April.”
The coal to gas ratio is key and “you can clearly see a shift down in the ratio over the past week or so, which corresponds to the higher power burns within the net load bins. Looking at it another way, as the net loads moved up over the past week or so, the next marginal MW was being produced by natural gas units. Looking at the regional breakout, the East and South Central regions saw the biggest changes to the upside.
“The question now is: What happens when we move back into a lower net load environment? Weather forecasts are calling for a cool start to May to go along with the 12,000 MWs of nuclear generation we will are expecting to return over that time. As thermal power demand falls over the next couple weeks we expect the coal/gas ratios to reset to what we saw last week as the primarily gas units come down and coal generation remains flat. However if the coal to gas ratio remains relatively stable, (coal and gas decrease at the same rate) that would be a very bullish signal to the gas market as we would need to increase our power burn forecast, and decrease our storage expectations, through early summer,” Richter said.
In physical trading next-day gas across the country at major trading hubs was a few cents higher to a few cents lower as next-day power pricing held steady.
Intercontinental Exchange reported that on-peak Thursday power at the ISO New England’s Massachusetts Hub rose just 45 cents to $32.48/MWh and next-day peak power at the PJM West terminal gained 71 cents to $30.47/MWh. Peak Thursday power at the Indiana Hub eased 50 cents to $36.00/MWh.
Gas at the Algonquin Citygate rose 7 cents to $3.29 but gas at the Chicago Citygate slumped 2 cents to $2.94. Deliveries to the Henry Hub eased 2 cents as well to $3.09 and gas on Dominion South was unchanged at $2.76.
Out West gas on El Paso Permian was quoted a nickel higher at $2.69 and gas at Opal rose 4 cents to $2.73. Gas priced at the SoCal Citygate added 7 cents to $3.17.
[Subscriber Notice Regarding NGI’s Market-Leading Natural Gas Price Indexes]
Futures opened a penny higher Wednesday morning at $3.20 as traders continued to factor in cooler temperatures going forward and early data suggested a small contraction in the storage surplus.
Adding to the bullish case was the release of a report that a major investment firm was raising its 2017 natural gas price forecast. Barclay’s Capital said it is raising its 2017 gas price forecast to $3.12/MMBtu from $3.02 on the back of stronger cash prices in the second quarter, supported by “heavy production maintenance and nuclear outages…We also increase our 2018 forecast from $3.11/MMBtu to $3.17/MMBtu (curve at $3.08/MMBtu).”
Analysts are questioning whether the current 299 Bcf year-on-five-year inventory surplus is too much to sustain current price levels.
“[T]he market has been tracking the five-year average price, but this may not be a sustainable valuation given that the April 21 storage total was 299 Bcf (15.8%) above the corresponding five-year average storage benchmark,” said Tim Evans of Citi Futures Perspective in closing comments Tuesday.
“It may also be a reflection of the market’s overbought condition, with money managers still holding substantial long positions in the CFTC data from April 25.”
Weather forecasters see only modest changes to forecasts of cooler conditions. “Mostly minor changes are noted overall [Wednesday], with nearly flat total demand adjustment estimates,” said Matt Rogers, president of Commodity Weather Group, in a Wednesday morning report to clients. “The short range is coming in a bit warmer toward the coasts and cooler toward the South. The 6-10 day is shifting slightly warmer for the Midwest and cooler toward the coasts, while the 11-15 day is edging cooling in the West and warmer in the East. The models are in fairly good agreement right now on the overall forecast, which continues to see more cooler than warmer conditions nationally.”
Cooler forecast temperatures on the horizon notwithstanding, the National Weather Service (NWS) predicts heating load in key eastern markets to be well below normal. For the week ending May 6, NWS sees New England at 69 heating degree days (HDD) or 24 below normal. New York, New Jersey and Pennsylvania are expected to have 54 HDDs or 21 fewer than normal. The greater Midwest from Ohio to Wisconsin is forecast to see 75 HDDs, or four fewer than normal.
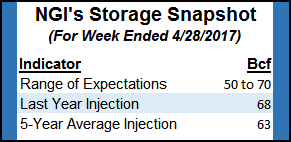
Estimates of Thursday’s storage report suggest that the trend of small decreases in the year-on-five-year storage surpluses is intact. Last year 68 Bcf was injected and the five-year pace stands at a 63 Bcf increase. Citi Futures Perspective calculates a 54 Bcf build and PIRA Energy is looking for a 66 Bcf injection. A Reuters survey of 21 traders and analysts showed an average 61 Bcf with a range of +50 Bcf to +70 Bcf.
Trading in the ICE cleared EIA Storage Swap settled Tuesday at 62 Bcf.
© 2024 Natural Gas Intelligence. All rights reserved.
ISSN © 1532-1231 | ISSN © 2577-9877 |