Marcellus/Utica Drove 7.1 Bcf/d U.S. NatGas Pipeline Expansion in 2016, Says FERC
With 7.1 Bcf/d entering service in 2016, last year marked one of the largest-ever year/year (y/y) expansions of U.S. natural gas pipeline capacity, according to FERC.
In its annual State of the Markets Report, released late last week, the Federal Energy Regulatory Commission said 43% of the total pipeline capacity that entered service in 2016 under its jurisdiction targets the Appalachian Basin, designed to move Marcellus and Utica shale gas to Midwest and Northeast markets.
“Staff expects the new natural gas pipeline capacity to continue contributing towards shrinking price differentials between regions throughout the U.S., and help keep natural gas prices relatively low,” FERC wrote.
Average prices across the country fell y/y in 2016, FERC said. Glutted storage following the mild 2015/2016 winter reduced demand for injections and pushed prices down across the map.
“Prices fell to record lows in the first half of 2016, before climbing through the second half of the year driven by steady domestic demand, rising exports and a drop in production,” FERC wrote.
“…Although prices in Boston were the highest in the country in 2016, they were 33% below 2015 levels. New York City prices experienced the largest year-on-year decrease, falling 42%, and in the fall prices fell to record lows…as new pipeline infrastructure transporting lower-priced Marcellus Shale gas into New England, New York and the Mid-Atlantic states became operational.”
The 2015-2016 winter was the warmest on record, going back to 1880, FERC said. “As a result, storage withdrawals during that season totaled 1.8 Tcf, the lowest in four years. By April, storage inventories stood at 2.5 Tcf…and by November 11, 2016, storage reached a record of 4.047 Tcf, edging the previous record of 4.009 Tcf set in 2015.”
December 2016 saw 38% more heating degree days (HDD) compared to the prior year period, helping storage withdrawals during the month to more than triple y/y to 684 Bcf. But January and February of this year saw 18% fewer HDDs y/y, contributing to the first-ever February injection during the week ended Feb. 24, FERC wrote.
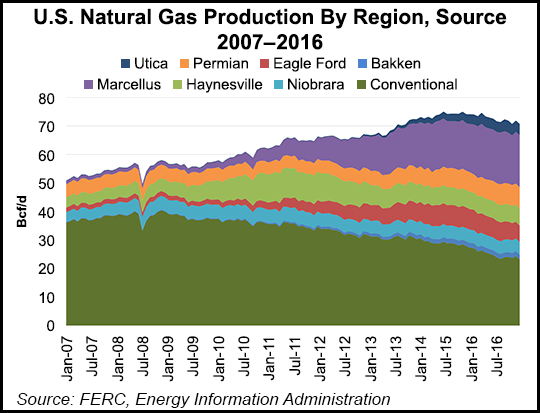
Production fell 2.5% y/y in 2016 to average 72.3 Bcf/d, the first y/y drop since the onset of large-scale shale production in 2005, according to FERC. The recovery in oil prices in 1Q2016 helped spur production out of liquids-rich areas in the Bakken Shale, the Marcellus/Utica and the Permian Basin, offset by a roughly 14% drop in conventional production and by declines in the Eagle Ford, Haynesville and Niobrara shales, the agency said.
“Natural gas production from the Marcellus and Utica shales accounted for 30% of the U.S. total in 2016, due to the prolific nature of these formations, relatively low production costs and proximity to the large Northeast markets,” FERC wrote. “In addition, new pipeline infrastructure reduced bottlenecks allowing additional gas to reach the demand centers.”
Total U.S. production should rebound in 2017 based on a projected 26% y/y increase in investment in North American exploration and production activities, FERC said.
A robust U.S. drilling backlog should help support production growth in 2017, FERC said, pointing to Energy Information Administration data showing 803 drilled uncompleted (DUC) wells in the Marcellus and Utica (13% of the U.S. backlog), along with 1,300 DUCs in the Eagle Ford and 1,700 in the Permian.
While DUCs could allow producing regions to be more price-responsive, “additional pipeline infrastructure, including gathering lines and other midstream facilities, may be needed before” gas from some of these DUCs can get to market, FERC said.
Natural gas overtook coal as the primary fuel source for U.S. electric generation on an annual basis for the first time ever in 2016, the agency noted. Power burn averaged 27.5 Bcf/d in 2016, a 4% y/y increase after a 17% increase the year before.
“States in the Midcontinent, Southeast and Mid-Atlantic experienced the highest increases in natural gas power burn in 2016,” FERC said. “In the Southeast, natural gas demand for power generation rose 2% in 2016, after experiencing a 21% increase between 2014 and 2015.”
Industrial sector demand rose 1.3% in 2016 (up 17% since 2005) as residential/commercial demand fell 5.1% on above-average temperatures during the heating months in the first part of the year. Overall domestic demand was up 1% in 2016 to 75.6 Bcf/d, according to FERC.
Meanwhile, exports played a much bigger role in the demand picture in 2016, with pipeline exports to Mexico averaging over 3.5 Bcf/d, while liquefied natural gas (LNG) exports became a source of demand pull for the first time last year after Cheniere Energy placed the first train at its Sabine Pass terminal into service last February and added a second train last fall.
“U.S. LNG exports jumped from virtually zero in 2015 to an average of 635 MMcf/d in 2016,” FERC said. “At this time, construction is underway at five U.S. LNG export terminals, with expected service dates ranging from August 2017 to 2021. When completed, these facilities will have a combined liquefaction capacity of over 8 Bcf/d.”
© 2024 Natural Gas Intelligence. All rights reserved.
ISSN © 2158-8023 |