Markets | NGI The Weekly Gas Market Report
NatGas Forward Prices Rose Last Week on Forecasted Long-term Supply/Demand Tightness
Natural gas forwards prices rose across the curve from Feb. 24 to March 2 as bullish sentiment heading into the summer trumped bearish headwinds from a lamb-like early end of winter tied together with a surprise storage build.
April forward prices climbed 3.5 cents on average during that time, but each subsequent month through the winter 2017-2018 strip posted stronger gains, according to NGI’s Forward Look. May forwards were up an average of 5 cents, the balance of summer (May-October) was up an average of 8 cents, and the winter 2017-2018 strip was up an average of 13 cents. Smaller increases were seen further out the forward curve.
The strength in natural gas forward prices is not completely surprising. With Lower 48 production continuing to hold just above 70 Bcf — despite a temporary run above 71 Bcf/d in February — the market has written off the winter season and is now focused on underlying tight supply-demand conditions heading into the summer.
“I don’t disagree that it’s a little surprising we’ve bounced off the lows. But the bounce is only surprising in the timing of it,” said Mobius Risk Group’s Zane Curry, a natural gas analyst. While Curry stopped short of making the case for a bullish market this summer, he did say soft production and increased volatility in the power sector could lead the market to test upside limits.
Declining well costs and related cost efficiencies from longer laterals and enhanced completions appears to have enticed producers to add to hedges when the NYMEX strip rose above $3, said NGI’s Patrick Rau, director of strategy and research. “So if they are hedged, they will produce. For example — and this is obviously an extreme example — Antero Resources is 100% hedged on the gas side for 2017 and 2018. This is Antero, one of the fastest growers in the Appalachia,” Rau said.
Much of the industry’s gas production growth in 2017, however, likely will be weighted in the second half of the year, with momentum continuing to increase going into 2018, “assuming gas prices do not absolutely collapse in the months ahead,” he said.
“That momentum will compete with gas in storage going into the winter, so that means we really need to see fairly strong demand this summer to account for that 2H17 production increase. Gas burn for power production will be key,” Rau said.
But renewable energy could throw a monkey wrench into power burn levels this summer, leading to increased volatility, Curry said. California already is experiencing such volatility as midday power prices in the California ISO (CAISO) and throughout the Western Electricity Coordinating Council (WECC) area during the week had fallen into negative territory as record-high hydro generation was being supplemented with increased solar output, according to data and analytics company Genscape Inc.
On Thursday, utility-side solar generation set a new record for output of 8,983 MW during
Hour Ending (HE) 14. This comes just a day after the previous record was broken, with Wednesday’s generation reaching 8,896 MW, also during HE 14, Genscape said.
“Though we saw negative power pricing in CAISO last spring due to strong solar output, the difference this year is the presence of robust hydro generation,” Genscape said.
Interestingly, gas prices in the region held fairly stable from Feb. 24 to March 2, with SoCal Border Average prices trading in an 11-cent range throughout the week and Pacific Gas & Electric trading in a 10-cent range, NGI data shows.
CAISO generation is nearing max capacity as many of the state’s major reservoirs are either at capacity and spilling, or getting very close to it, Genscape said. California hydro has been boosted by the “Atmospheric River” and “Pineapple Express” events creating heavy rains at lower elevations; the outlook is for strong hydro to keep up with snowpack at higher elevations have been lifted to 183% of normal.
Snowpack up north in the Bonneville Power Administration has also surged. After having been slightly below normal for most of winter, snowpack is now well above 100% across Washington State’s main hydro basins. Snowpack in Idaho, Montana, and Wyoming has built rapidly in recent weeks, too, the Louisville, KY-based company said.
“As a result, with hydro strong throughout the WECC, negative power prices are being seen all the way from the Pacific Northwest and Wyoming down to Southern California and Arizona. We expect negative prices to be a common feature for the remainder of the spring with snowpack at such robust levels and continuing growth in wind and solar generation,” Genscape said.
Meanwhile, Texas is also expanding its renewable portfolio. Wind generation in the Electric Reliability Council of Texas increased 30% from 2015-2016, and another 4,000 MW of natural gas, wind and solar generation is expected to be online before the start of the summer season.
But as Curry noted, “the sun doesn’t always shine, the wind doesn’t always blow and the rain doesn’t always fall. Natural gas is always available.”
Looking ahead to the next few weeks, Curry said the interplay between cash prices and prompt-month futures will be interesting to watch. As of Thursday, Henry Hub cash sat at a 21-cent discount to the Nymex April futures contract. “If cash stays as depressed as it is, we may need to see another retracement in the nearby contract,” he said.
Indeed, mild weather continues to pressure cash markets, and near-term outlooks show only brief periods of cold. For example, a relatively strong cold blast was sweeping across the Great Lakes, Mid-Atlantic and the Northeast, while tapping a rather impressive shot of Canadian air with polar origins, according to forecaster NatGasWeather. This will bring strong natural gas-based heating demand the next couple nights as lows drop into the teens to locally below 0 degrees Fahrenheit.
“It would be rather impressive if cold would linger more than a couple days, but like most times this winter season, it won’t last, as strong high pressure and exceptionally mild conditions return east of the Rockies late this weekend through the middle of next week with demand again dropping well below normal,” NatGasWeather said midday Friday.
After March 15, however, is when the forecaster sees the weather data trending a touch cooler over the northern and eastern United States, which could continue to do so over the weekend break. Indeed, international weather models overnight into Friday showed more cold risk in the East on days 13-15 as they provide evidence of the eastern ridge breaking down, while the European weather ensembles never real show an eastern ridge able to form at all as there is more signiï¬cant cold risk across the North, according to Bespoke Weather Services. Climate guidance continues to show mid-late March could hold a bit more cold risk too, but conï¬dence is low.
The slightly more bullish weather outlook for mid-March was expected to keep prices relatively supported through the weekend, Bespoke said, with prices lingering between $2.70 and $2.90. NatGasWeather agreed the current trading range was likely to hold as the market has been stuck in the trading range since last week, with little movement in Friday trading. “This suggests the markets are viewing current prices as near fair value,” the forecaster said.
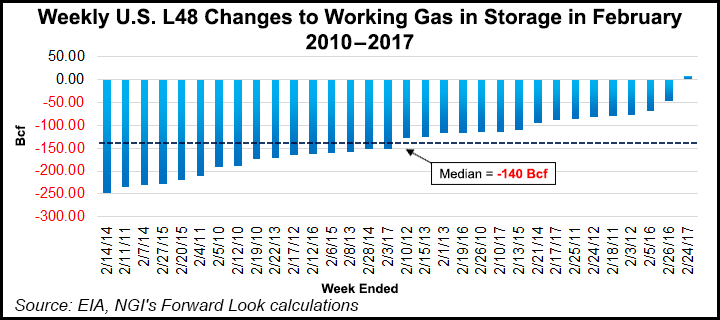
Indeed, not even a surprise winter-season storage build was enough to knock the Nymex April futures contract out of its recent trading range. The U.S. Energy Information Administration reported a 7 Bcf build to storage inventories for the week ending Feb. 24. Inventories now stand at 2,363 Bcf, which is 187 Bcf below year-ago levels but 295 Bcf above the five-year average of 2,068 Bcf.
According to EIA data, the only other time there was an injection in the months of December, January or February since 2010 was for the week ending Dec. 7, 2012, which saw an injection of 2 Bcf. “A 7 Bcf injection in late February. Ouch,” Rau said. “The previous five-year average for Feb. 24 is a withdrawal of 114 Bcf/d, with a five-year maximum withdrawal of 226 Bcf during 2015.”
Despite the obviously bearish report, Nymex April futures closed last Thursday five-tenths of a cent higher at $2.804. May followed suit with a similar gain to $2.914.
Looking ahead, NatGasWeather said it expected to see a couple more draws that will be lighter than five-year averages, allowing surpluses to grow to more than 350-plus Bcf. Thereafter, they should then should begin to gradually decrease as a tight background environment begins to take advantage, even under mild weather patterns. “This, of course, will require production to hold steady and not significantly increase,” the forecaster said.
Taking a closer look at the gas markets, it appears the robust hydro situation in the Pacific Northwest is beginning to impact prices. At Northwest Pipeline-Sumas, April forward prices rose about 2 cents from Feb. 24 to March 2 to reach $2.13, a gain that is in line with Nymex futures. Sumas prices for May, however, rose just 2 cents during that time to $2.12, while Nymex May futures climbed 5 cents to $2.91. Sumas summer 2017 forward prices were up 6 cents to $2.43; the Nymex summer 2017 strip was up 9 cents to $3.065.
Spot prices at Sumas averaged $2.11 in 2016 and $2.32 in 2015, NGI historical data show.
[ Subscriber Notice Regarding NGI’s Market-Leading Natural Gas Price Indexes]
Meanwhile, California markets were unusually stronger for April and May. Southern California Border Avg. April forwards climbed 7.5 cents from Feb. 24 to March 2 to reach $2.59, according to Forward Look. May forwards rose 9 cents to $2.63, the summer also tacked on 9 cents to reach $2.87 and the winter 2017-2018 edged up 12 cents to $3.345. Meanwhile, SoCal Border Avg. summer prices averaged $2.49 in 2016 and $2.69 in 2015.
At Pacific Gas & Electric Citygates, April forwards were up 6 cents during that time to $3.11, May forwards were up 7 cents to $3.15, the summer 2017 was up 10 cents to $3.30 and the winter was up 13 cents to $3.545. PG&E summer prices averaged $2.78 in 2016 and $3.07 in 2015, according to NGI.
© 2024 Natural Gas Intelligence. All rights reserved.
ISSN © 1532-1231 | ISSN © 1532-1266 |