Markets | Infrastructure | NGI All News Access | NGI The Weekly Gas Market Report
Flattening Basis Will See Capacity Trades ‘Going Short or Going Long,’ Skipping Stone Says
As basis differentials erode with new pipeline expansions and reversals coming online, 2017 could see capacity markets shift to increasingly shorter- or longer-term trades, according to new analysis from Skipping Stone and Capacity Center.
“There are trends, we believe, underway that will take more time to analyze, but as basis begins to go flat across the basins of the country, it will be interesting to see if the market responds by going short or going long,” Skipping Stone President Greg Lander told NGI. “There’s no indication today of a dominant trend that will erupt. We see something’s happening, but we don’t know which fork in the road it will take.”
As basis differentials shrink, traders may opt to lock in forward prices in deals that don’t take effect until months from now, or they may look to capitalize on short-term opportunities in the spot market. It also remains to be seen how capacity traders will respond in terms of the duration of their deals.
“Both of those will tell us people’s views of capacity prices,” Lander said.
Capacity Center, owned and operated by Skipping Stone, collects capacity release and operational notice information from the interstate pipeline system. The firm recently released its pipeline capacity trader rankings for 2016.
In this year’s report the firm identified a trend toward forward capacity trading in 2016, breaking it down into trades 60 days or more before the effective date of the capacity and trades 30-59 days from the effective date.
There were 88 companies making capacity trades 60 days or more from the effective date in 2016, with the average for the group being 222 days in advance. The annualized volume of those deals was 3.63 Bcf/d, compared to 1.93 Bcf/d for deals effective 30-59 days from the trade date. The firm said its data shows that just over 10% of all capacity traded in 2016 changed hands more than 30 days prior to the release of the capacity.
“We can conclude from this that top traders are more actively seeking out release deals prior to their hitting the spot capacity market,” the firm said.
This year Capacity Center made some tweaks to its methodology for ranking the top capacity traders. Besides switching from a partial to full year’s worth of data, for 2016 Capacity Center decided to report each company’s total traded capacity on an annualized basis, in part to normalize the effects short- and long-term deals had on the numbers, according to Lander.
“We found that there were a number of companies that would opportunistically have a couple of very large deals but for very short periods of time, and it was skewing their apparent presence in the market against those who had lots and lots of fives and tens who controlled them for longer periods of time,” he said.
On an annualized basis, the top 5 capacity traders in the 2016 rankings remained largely unchanged from 2015. Independent energy firm Tenaska claimed the top spot with 4,776,728 Dth/d of annualized capacity traded across 478 deals. BP came in at number two with 4,530,054 Dth/d across 941 deals.
Direct Energy moved up one spot to third with 3,612,634 Dth/d traded across 2,467 deals, while Sequent dropped one spot to fourth at 3,241,190 Dth/d and 747 deals. Constellation rounded out the top five with 2,995,488 Dth/d and 898 deals.
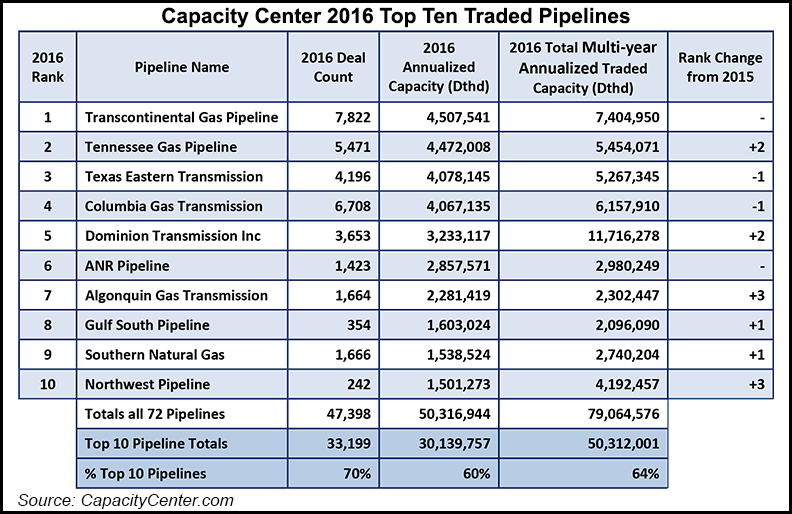
In 2016, Capacity Center tallied 47,398 capacity trades and 523 distinct trading partner company groups trading 50.3 Bcf/d of annualized capacity across 72 pipelines. The top 20 capacity traders accounted for 66% of all annualized capacity traded. For ranking purposes, Capacity Center grouped affiliated companies and only counted transactions between non-affiliated entities.
Of the top pipelines with capacity traded in 2016, Transcontinental Gas Pipe Line held onto its top spot from last year’s rankings with 4,507,541 Dth/d of annualized capacity traded in 7,822 deals. Tennessee Gas Pipeline moved up from fourth to second this year at 4,472,008 Dth/d and 5,471 deals, leapfrogging Texas Eastern Transmission (4,078,145 Dth/d and 4,196 deals) and Columbia Gas Transmission (4,067,135 Dth/d and 6,708 deals).
The top 10 traded pipelines accounted for 60% of all annualized traded capacity in 2016.
© 2024 Natural Gas Intelligence. All rights reserved.
ISSN © 1532-1231 | ISSN © 2577-9877 | ISSN © 1532-1266 |