NatGas Forwards Prices Perk Up on Bullish 151 Bcf Storage Withdrawal
After swinging throughout the week, much like weather forecasts, natural gas forwards and futures markets turned decidedly bullish on Thursday after a much larger-than-expected storage report, lifting February forwards prices up an average 17 cents that day and up an average 10 cents between Jan. 6 and 12, according to NGI’s Forward Look.
The U.S. Energy Information Administration reported a 151 Bcf withdrawal from storage inventories for the week ending Jan. 6, a much larger pull than market estimates in the upper 130 Bcf to low 140 Bcf range.
“This bullish surprise seemed a correction to the bearish miss last week,” said weather forecasters at Bespoke Weather Services. “We did add 44 TDDs [total degree days], which certainly played a large role in this, but this number also indicated some tightening outside of that and shows that a very large drawdown can be expected next week.”
At 3,160 Bcf, natural gas stocks were 363 Bcf below year-ago levels and 4 Bcf below the five-year average of 3,164 Bcf.
And while next week’s storage report could indeed reflect a sizeable withdrawal considering the cold blast that blanketed much of the U.S. at the beginning of the week — likely above -200 Bcf, according to NatGasWeather — market bulls may need to brace themselves for a disappointing report the following week.
“Current supplies versus the five-year average are now only carrying a deficit of -18 Bcf but will increase next week to around -70 Bcf as cold from last weekend into early this week is accounted for. But then the coming mild spell is expected to flip deficits back to surpluses just in time for cooler temperatures to arrive after Jan. 23,” NatGasWeather forecasters said on Thursday.
Indeed, Genscape meteorologists are calling for an average of about 180 heating degree days (HDD) in the Lower 48 for the next week, 65 HDDs warmer than the five-year average.
Bespoke agreed the market should be prepared for a couple of lean storage withdrawals on the horizon thanks to the widespread warmth forecast, and said this could be playing into what capped upside a bit in the market Friday despite the rise in prices overnight, especially as money managers continue to hold near-record long positions.
Indeed, the Nymex February gas futures contract was up just a couple of pennies to $3.41 at midday.
NatGasWeather said it was important that cold temperatures last into early February for the bullish case to stand as any milder trends would likely be met with considerable disappointment as the markets have been expecting supplies to carry moderate deficits by the end of the winter heating season, and they’ve stalled near even in recent weeks.
And as of Friday, a couple of weather models added in some bullish risk for the next couple of weeks that could easily allow heating demand to at least return to seasonal averages by the end of the month, Bespoke said.
The Global Forecast System, the Canadian Meteorological Center and the European Centre for Medium-Range Weather Forecasts all added bullish risk to their long-range outlooks, as atmospheric indicators support a gradually colder pattern and climate models do show the U.S. trending colder by Day 15, Bespoke said. “Overall, these trends are expected to support natural gas prices through the day today, and we may see prices move towards the $3.50 level,” it said.
Taking a closer look at the natural gas markets, the Nymex futures market set the tone for widespread gains during the week. After flip-flopping throughout the week, the Nymex February futures contract ultimately gained 10 cents between Jan. 6 and 13 to reach $3.386. March futures were up 8 cents to $3.37 and the summer 2017 strip was up 10 cents to $3.40. Even the winter 2017-2018 futures strip climbed by the double digits, tacking on 11 cents to hit $3.58. The rest of the curve was up 5 cents or less.
“I think part of the strength came from technical traders, as it often does over shorter-term trading horizons,” said NGI’s Patrick Rau, director of strategy and research. The February contract has been hugging the bottom of its Bollinger Band since 2017 began, so an uptick may have been coming from that anyway, he said.
The Bollinger Band is a technical indicator that creates a trading range based on the average and standard deviation of the previous 20 days. The range is two standard deviations above and below the moving average. Statistically speaking, 95% of all observations are supposed to lie within a two standard deviation range, so if a price falls to the bottom of the band, it should rebound, and vice-versa, Rau explained.
But the selloff from last week left February in oversold territory, and the prompt month had no trouble bouncing off its 100-day moving average on Jan. 9 and 10. “The 100-day moving average now stands at $3.105, and that may prove to be the next short-term support level,” Rau said.
Meanwhile, some markets saw more extreme volatility than others. Most notable was at Transco zone 6-New York, which saw its February forwards package plunge 48 cents from Jan. 6 to 9, but then jump 35 cents on Jan. 10. The whipsaw action inthe New York quote continued throughout the week, with February forwards ultimately losing 16 cents from Jan. 6 to Jan. 12, according to Forward Look.
“Weather weather weather. It’s far too extreme,” a Northeast trader said when asked about the culprit behind this week’s price action.
Indeed, cold weather on the Eastern Seaboard and in the Northeast in general drove throughput to a new record on the Transco pipeline on Jan. 8. Transco — which claims the title of the nation’s largest natural gas transmission system — delivered a record-breaking 13.7 million Dth that day, surpassing the previous highof 13.5 million Dth set on Jan. 7, 2015.
The Transco system, which stretches from South Texas to New York City, also established a new three-day market area delivery record Jan. 7-9, averaging 13.6 million Dth and eclipsing the previous three-day peak of 12.9 million Dth.
Contributing to the volume records were Transco expansions that were completed during 2015 and 2016, Williams Partners said. Virginia Southside(250,000 Dth/d), Northeast Connector(100,000 Dth/d), Mobile Bay South III (225,000 Dth/d), Leidy Southeast (525,000 Dth/d) and Rock Springs(192,000 Dth/d) all entered service during the last 22 months, the company said.
Construction is under way on Transco’s Garden State, Gulf Trace, Dalton, Hillabee (Phase 1) and Virginia Southside II expansion projects.
The trader said a large power line feeding into New York also went down on Thursday, which likely added to the volatility in the New York market. Indeed, much of the action in the New York forwards market was focused on the prompt month as the rest of the curve was more in line with the rest of the country.
The Transco zone 6-NY March forward price climbed 11 cents between Jan. 6 and 12 to reach $3.96, the summer 2017 forward price was up 16 cents to $2.89 and the winter 2017-2018 forward price was up 22 cents to $6.18, Forward Look data shows.
Meanwhile, points along the Iroquois pipeline moved against the pack this week as maintenance wrapped up at the Boonville Compressor Station, which had affected several services utilizing Waddington as an alternate receipt point. The work was reported as completed on Jan. 9. Separately, Iroquois issued a notice on Jan. 12 stating that nominations were at capacity at the Brookfield Interconnect with Algonquin Gas Transmission.
Iroquois Waddington February forward prices slid 23 cents between Jan. 6 and 12 to reach $6.33, while March forward prices slipped 6 cents to $4.15, according to Forward Look.
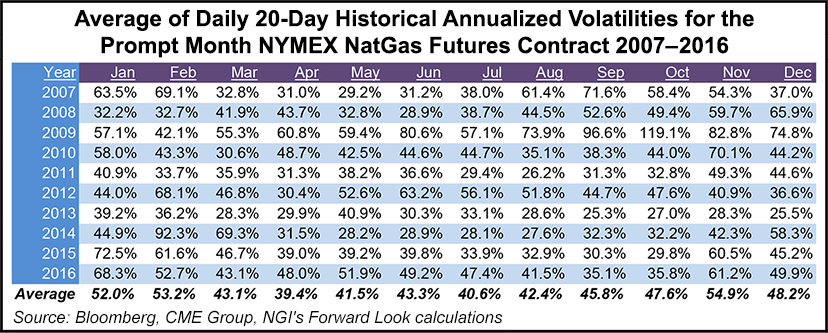
Where February forwards go from here will certainly depend on time specific supply and demand factors, but if history is any indication, then February should continue to be volatile. “Actually, the February NYMEX natgas contract tends to be slightly more volatile than January, based on activity over the last 10 years,” Rau said. He calculates that between 2007-2016, the average annualized 20-day volatility for the prompt month NYMEX contract in February was 53.2%, a few ticks higher than the 52.0% figure for January. “Volatility can certainly vary regionally during the winter, particularly in the U.S. Northeast and Midwest, but prompt month NYMEX futures prices at Henry tend to continue bouncing around at a pretty good clip in February as well.”
© 2024 Natural Gas Intelligence. All rights reserved.
ISSN © 1532-1231 | ISSN © 2577-9877 |