Markets | NGI All News Access | NGI Data
NatGas Cash Adds A Penny, Market Technicians Outline Advance to $5; January Adds 9 Cents
Most physical points traded about a dime lower Thursday as traders hunkered down and got their deals done before the Energy Information Administration (EIA) released its natural gas storage report.
Eastern points, however, bounded higher by as much as $3, and the NGI Daily Spot Gas Average ended up a penny higher at $3.81. EIA reported a withdrawal of 42 Bcf, about what the market was expecting, but prices advanced and closed at the high end of the day’s range. At the close, January had gained 9.2 cents to $3.695 and February was up 8.7 cents to $3.676. January crude oil recovered most of Wednesday’s losses and rose $1.07 to $50.84/bbl.
Next-day gas prices soared at New England points as pipelines reported stout capacity restrictions. Algonquin Gas Transmission reported restrictions at its Stony Point, Oxford, Cromwell and Burrillville compressor stations. In addition, Algonquin “has restricted 100% interruptible and approximately 91% secondary out-of-path nominations sourced at the Tennessee Gas Pipeline interconnect at Mendon, a physical receipt meter. No increases in receipts sourced from Mendon will be accepted,” the company said on its website.
Gas deliverable at the Algonquin Citygate rocketed higher by $3.57 to $9.57, and deliveries to Iroquois Zone 2 jumped $1.38 to $6.19. Gas on Tenn Zone 6 200L jumped $2.88 to $10.03.
Most other major market points slipped into the red. Gas bound for New York City on Transco Zone 6 rose 7 cents to $4.20, but gas at the Chicago Citygate fell 16 cents to $3.69, and deliveries to the Henry Hub shed a dime to $3.66.
Gas on El Paso Permian was quoted 12 cents lower at $3.47, and deliveries to Transwestern San Juan dropped 12 cents as well to $3.50. Gas at the SoCal Citygate changed hands 14 cents lower at $3.70.
In financial trading futures worked higher Thursday morning after EIA reported a storage withdrawal that was about in line with what traders were expecting.
EIA reported a 42 Bcf storage withdrawal in its 10:30 a.m. EST release, whereas traders were expecting a pull about 1 Bcf greater. January futures reached a high of $3.680 immediately after the figures were released, and by 10:45 a.m. January was trading at $3.628, up 2.5 cents from Wednesday’s settlement.
“You see the way this market goes regardless of the number,” a New York floor trader told NGI. “If it goes down 7 cents, it comes back basically to where we were before, and if it goes up 7 cents we go back down to where it was 15 minutes before. You’ve got to pick your point right at the onset and then get out. Then you are in good shape. It’s a little scary to have your position on before the number comes out.
“I think we have to look at $3.75 as resistance and $3.50 as support,” he said.
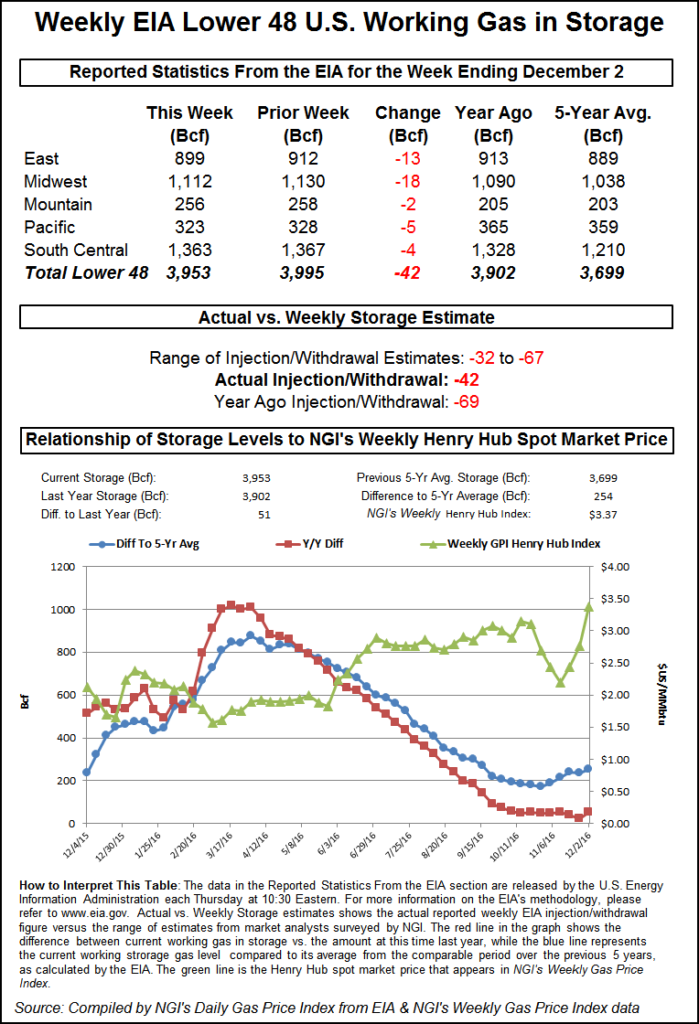
“The 42 Bcf net withdrawal for last week was in line with revised consensus expectations for 42-43 Bcf but moderately bearish relative to the 61 Bcf five-year average for the date,” said Tim Evans of Citi Futures Perspective. “However, we fully expect the market to focus more on the upcoming cold than only last week’s details.”
Inventories now stand at 3,953 Bcf and are 51 Bcf greater than last year and 254 Bcf more than the five-year average. In the East Region 13 Bcf was withdrawn, and the Midwest Region saw inventories decrease by 18 Bcf. Stocks in the Mountain Region fell 2 Bcf, and the Pacific Region was down by 5 Bcf. The South Central Region shed 4 Bcf.
Technical traders saw Thursday’s trading as critical and see the groundwork in place for significantly higher prices. “The last two days were looking a little toppy, but Thursday took back all those losses, and I take that as a pretty dramatic confirmation that the trend is still up,” said Walter Zimmermann, vice president at United ICAP.
“My critical pivot was $3.68, and if natural gas doesn’t stop there, that opens the door to $4.30 and $4.96. If we get a weekly close over $3.68, and it’s kind of teetering there now, but any further gains Friday we could get that. In my book I am struggling to find any candidates for resistance until that $4.30 to $4.96 area.”
Zimmermann added that Thursday’s advance as well as recent price action is “pretty conclusive evidence that $1.611 back in March was the 15-year commodity cycle low. 2016 was the year we were looking for the next 15-year low.
“We’ve had bigger rallies previously such as the $1.902 to $6.493 and others but they were counted as bear market corrections within the 15-year cycle decline. This is more than that. Assuming Thursday’s gains are not given back Friday, let see what happens up to the $4.30 to $4.96 zone,” he said.
Weather models backed off the recent trend of ever-colder forecasts. “[Thursday’s] six-10 day forecast is not as cold as the previous forecast over the majority of the central and eastern U.S. as models have wavered with the pending cold shot,” said WSI Corp. in its Thursday morning report to clients.
“CONUS GWHDDs are down three to 168.7 for the period, [but] this is 26 above average.”
WSI said, “Forecast confidence is only near average at best today. Medium-range models are in reasonable agreement and have shown some consistency with the general large pattern progression. However, there are numerous technical/localized differences and inconsistency throughout the period that impedes confidence levels.”
Going into the storage report, United ICAP predicted a 35 Bcf withdrawal, and IAF Advisors was looking for a 33 Bcf decline. A Reuters survey of 18 traders and analysts showed an average 43 Bcf with a range of -32 Bcf to -67 Bcf.
Industry consultant Bentek Energy, utilizing its flow model, predicted a 35 Bcf withdrawal but saw any increases in the storage surplus as history going forward. “While this week’s report will add to the surplus relative to the five-year average and to last year’s levels the current supply and demand daily estimate for the week ending Dec. 8 suggests that the surplus relative to last year will fall to a deficit with the release of the report on Dec. 15 and significantly reduce the surplus relative to the five-year average.”
© 2024 Natural Gas Intelligence. All rights reserved.
ISSN © 1532-1231 | ISSN © 2577-9877 |