NatGas Bulls Relishing Exuberant December Bidweek
It was almost as if the bulls couldn’t wait for the first indication winter was on its way, and December Bidweek prices rocketed to the highest bidweek national average since February of 2015.
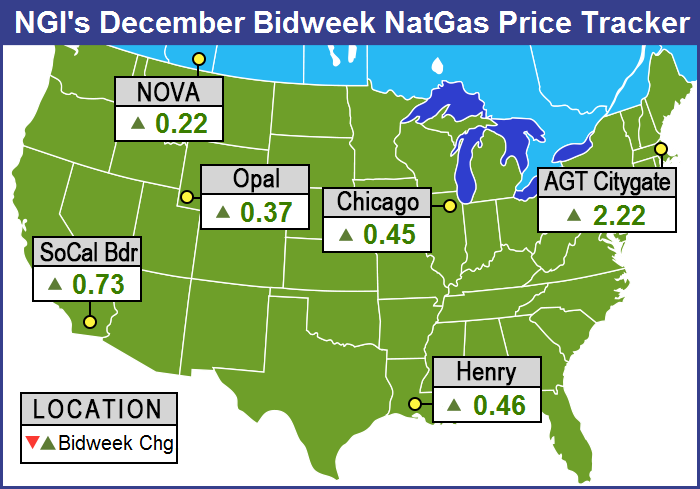
The NGI National Bidweek Average for December rose a stunning 72 cents to $3.20, and all points followed byNGI made healthy double-digit gains with none showing a loss. The weakest individual point proved to be Westcoast Station 2 with a rise of $C0.05 to $C2.29/Gj, and the point showing the greatest gain was Algonquin Citygate with an advance of $2.22 to average $4.71, followed closely by Tennessee Zone 6 200 L with a rise of $2.11 to $4.63.
The last time a bidweek national average bested December 2016 was back in Feb. 2015 at $3.23. Comparing apples-to-apples, December 2016’s $3.20 level marks a 93-cent premium over December 2015’s average.
Regionally, eastern points showed the greatest advances with the Northeast adding $1.87 to average $3.99 and Appalachia up $1.22 to $2.50.
At the low end of the totem pole, East Texas gained 40 cents to $3.09 and South Texas added 43 cents to $3.17. The Rockies jumped 46 cents to average $3.02 and the Midcontinent climbed 45 cents to $3.05. South Louisiana added 46 cents to $3.17 and the Midwest gained 52 cents to $3.33. California rose 58 cents to $3.42 and the Southeast tacked on 70 cents to $3.47.
December futures settled at $3.232, up a stout 46.8 cents from the settlement of the November contract.
Bidweek traders took the high quotes in stride. “Prices were nice and high and we were looking at basis of +10 cents and +12 cents for our purchases on Consumers and Michcon,” said a Great Lakes marketer.
A Midwest utility buyer said, “We just needed to buy a little bit. There were plenty of people willing to sell. We didn’t use much of our storage in November so we are planning to use more storage gas in December to make up for that. We typically buy at index on Northern Natural.”
Post bidweek market bulls were treated to an early Christmas Thursday in the form of Energy Information Administration (EIA) storage withdrawal figures that were slightly smaller than expected, but still significant. Going into the report for the week ending Nov. 25, expectations were for the first meaningful inventory drawdown of the nascent heating season. Last year 35 Bcf was withdrawn and the five-year pace stands at a 44 Bcf decline.
PIRA Energy calculated a pull of 50 Bcf, and First Enercast is expecting a withdrawal of 62 Bcf. A Reuters survey of 25 traders and analysts showed an average 53 Bcf decline with a range of -26 Bcf to -65 Bcf.
The EIA reported a 50 Bcf storage withdrawal in its 10:30 a.m. EST release. January futures reached a high of $3.479 immediately after the figures were released and by 10:45 a.m. January was trading at $3.470, up 11.8 cents from Wednesday’s settlement.
Traders saw the market move off the number as somewhat ephemeral. “I think it’s going to do a little pull back from this number,” said a New York floor trader. “It didn’t really tap the $3.48 area so I think it’s going to pull back to the $3.41 to $3.43 area and there is the possibility to slip back to the upper $3.30s.
“Traders are trying to hold the market up, but at this time it doesn’t look like a strong hold,” the trader added.
“The net implied flow this week was -50 Bcf, still slightly [greater] than the five-year average of -44 Bcf as stockpiles began to rapidly fall back towards the five-year historical range,” said Harrison, NY-based Bespoke Weather Services. “Next week’s number will likely be a bit more loose, though even this week saw a small amount of loosening as an additional 54 TDDs only drew 48 Bcf more out of storage. We may struggle to break above $3.50 resistance.”
Inventories now stand at 3,995 Bcf and are 24 Bcf greater than last year and 235 Bcf more than the five-year average. In the East Region 23 Bcf were withdrawn and the Midwest Region saw inventories decrease by 23 Bcf as well. Stocks in the Mountain Region fell 1 Bcf, and the Pacific Region was unchanged. The South Central Region shed 3 Bcf.
As bidweek trading came to a close Wednesday gas for Thursday delivery bounded higher; the pricing landscape got a firm boost from a strong screen, expectations for storage withdrawals below seasonal averages, soaring petroleum quotes and a firm power price environment.
One next-day point followed by NGI fell into the loss column, one point was unchanged, and all others scored solid double-digit gains on Wednesday. The NGI National Spot Gas Average jumped 20 cents to $3.13. Futures did their part to lift physical quotes. January settled at $3.352, up 3.7 cents and February added 1.8 cents to $3.359. January crude oil soared $4.21 to $49.44/bbl.
The day’s marquee event was the announcement of an agreement by the Organization of the Petroleum Exporting Countries (OPEC) to itsfirst global oil production reduction in eight years, cutting output by 1.2 million b/d effective Jan. 1. On the news, U.S. crude futures surged almost 8% in early trading to about $48.56/bbl on the New York Mercantile Exchange. Brent prices jumped close to 8% as well to trade at about $51/bbl on the ICE Futures Exchange.
Members of the Saudi Arabia-led cartel said the agreement would reduce output from the current ceiling of 33.6 million b/d to about 32.5 million b/d, representing a reduction of around 1% of global production. Saudi Arabia is to make the biggest reductions, estimated at around 486,000 b/d.
Market observers saw the agreement as a production stimulus.
“To the extent that it supports price and incentivizes American producers we may see more natural gas come out as well,” said Al Levine, principal at Powerhouse LLC, a Washington DC-based energy risk management and trading firm.
A long-term price ceiling could be on the horizon. “As a result it may put something of a top on the gas price,” he said.
Other traders don’t see the OPEC agreement as impacting natural gas. “It seems to me the move in natural gas is panic short-covering,” a New York floor trader told NGI.
Overnight weather models turned slightly cooler, but agreement between the various models used was lacking.
The U.S. weather model “is back on the colder side, sort of,” said Commodity Weather Group President Matt Rogers in a Wednesday morning report. “After a few weird days when the American weather model guidance ran warmer than the European versions for the 11-15 day outlook, the roles have reversed back to their usual roles with the American ensemble now the coldest-looking 11-15 day.
“The ‘sort of’ part is that now the European ensemble is colder/faster than the American version in the six-10 day range as it sends cold to Texas faster and sweeps the cold front eastward across the U.S. faster next week. We edged our timing slightly faster for the Midwest and East, but were a bit more aggressive for Texas given concerns of faster southward progress of the colder air along the flat Plains.”
Weather uncertainty along with a myriad of factors ranging from full storage, slowing production, and a mild start to the winter have producers layering in a greater number of hedges. “If producers are hedged, they will be drilling,” one observer noted.
BTU Analytics analyst Corey Boettiger said it had been “a rocky road for natural gas producers.” In a review of 3Q2016 natural gas hedging by U.S. producers, Boettiger said 2017 hedges “were up across the board…Based on the new numbers of roughly 25 select independent producers, gas hedges for 2017 are up by nearly 3.5 Bcf/d compared to where they were in the second quarter.”
Notable additions included nearly 1 Bcf/d by Chesapeake Energy Corp. and 850 MMcf/d by Southwestern Energy Co. Range Resources Corp. added hedges through its acquisition of Memorial Resource Development Corp., while Rice Energy added hedges through its acquisition of Vantage Energy, Boettiger noted.
“Among the chosen producers, nearly 50% of 2017 gas production is hedged, up from 35% of 2017 production in the second quarter of this year.”
In physical market activity on Wednesday, spot gas prices benefited from a firm power market. Intercontinental Exchange reported that next-day on peak power at the ISO New England’s Massachusetts Hub rose $1.37 to $31.14/MWh, and Thursday power at the PJM West terminal added $1.38 to $31.07/MWh. On the West Coast, next-day power at SP-15 rose $2.53 to $38.25/MWh.
Gas at theAlgonquin Citygate on Wednesday for Thursday delivery jumped 42 cents to $2.94, and deliveries toIroquois, Waddington gained 15 cents to $3.55. Gas on Tennessee Zone 6 200 L jumped 18 cents to $3.25.
Major market centers were solidly in the black.
Gas at theChicago Citygate added 15 cents to $3.29, and deliveries to theHenry Hub rose 26 cents to $3.29. Gas atOpal tacked on 22 cents to $3.20, and gas priced at theSoCal Border Avg. rose 17 cents to $3.31.
© 2024 Natural Gas Intelligence. All rights reserved.
ISSN © 1532-1258 | ISSN © 2577-9877 |