Markets | NGI All News Access | NGI Data
NatGas Cash, Futures Labor Under Record Storage; December Falls 6 Cents
Physical natural gas traders typically try to get their deals done ahead of the release of Energy Information Administration (EIA) storage data, and those that did look to have beaten futures traders to the punch.
The NGI National Spot Gas Average declined a stout 19 cents with all but two points followed by NGI falling into the loss column. The Northeast and Appalachia took the day’s biggest hits, but both market zones and producing basins posted hefty double-digit declines. The EIA reported a storage build of 30 Bcf for the week ending Nov. 11, a touch less than what surveys and estimates by analysts were expecting, but the build placed storage inventories in new record territory for the second straight week. At the close December had dropped 6.1 cents to $2.703, and January was lower by 4.5 cents to $2.875. December crude oil eased 15 cents to $45.42/bbl.
Natural gas futures tumbled to session lows once the storage figures were released, although the injection was about in line with market expectations. December futures reached a low of $2.690 immediately after the figures were released, and by 10:45 a.m. EST, December was trading at $2.693, down 7.1 cents from Wednesday’s settlement.
“We were hearing 31 Bcf so there wasn’t much of a difference there,” said a New York floor trader. “I didn’t think a 30 Bcf build versus a 31 Bcf would make all that much difference. We’ve been above the one-year and five-year storage averages for how long now? There just isn’t any upward swing to this market.”
Others also recognized the broader bearish implications. “The 30 Bcf net injections was in line with consensus expectations and so neutral on that score,” said Tim Evans of Citi Futures Perspective. “At the same time, we do note the bearish comparison with the 3 Bcf five-year average figure, as well as the total reaching a new all-time high of 4,047 Bcf. So perhaps the bottom line on the report is that it was fundamentally bearish, as expected.”
Market technicians continue to give an edge to the upside. “Bulls now need to clear $2.834-2.860, thanks to this congestion,” said Brian LaRose, a market technician at United ICAP prior to Thursday’s trading. “Bears still need to take out the $2.546 low. Clear resistance and an extended multi-day drift to the upside becomes possible from here.
“Take out the low before resistance can be breached and Natgas has room down to $2.489-2.441-2.424, even $2.281-2.205. The short-term technicals still suggest the bulls have the edge here.”
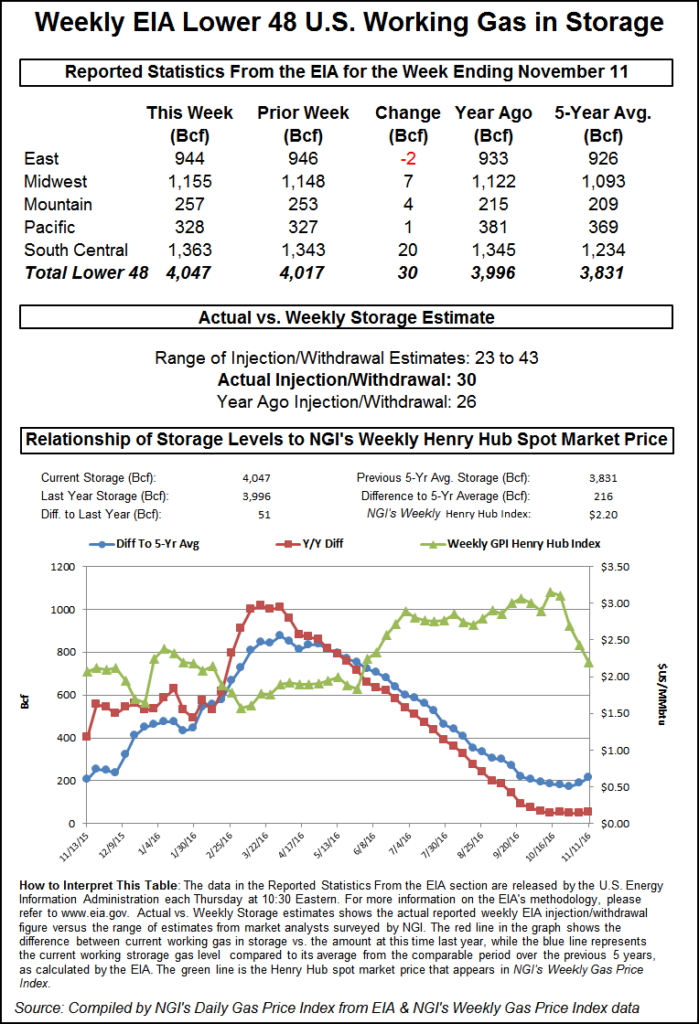
Inventories now stand at 4,047 Bcf and are 51 Bcf greater than last year and 216 Bcf more than the five-year average.
Working gas in storage has set an all-time record two weeks running. Current storage levels sit 38 Bcf above last year’s high mark of 4,009 Bcf for the week ending Nov. 20, 2015, which previously held the record until last week. EIA’s demonstrated maximum capacity for storage is 4,343 Bcf.
For the week, the East Region saw 2 Bcf withdrawn and the Midwest Region saw inventories increase by 7 Bcf. Stocks in the Mountain Region rose 4 Bcf, and the Pacific Region was up by 1 Bcf. The South Central Region added 20 Bcf.
Salt cavern storage was up 9 Bcf at 394 Bcf, while the non-salt cavern figure was up 11 Bcf at 968 Bcf.
Weather forecasters are scratching their heads trying to rationalize different model interpretations in more deferred time periods. “For the fourth day in a row, we continue to track major model differences for the upcoming 11-15 day range, which is now inching into early December,” said Commodity Weather Group in its Thursday morning report to clients. “With very few short-range changes, the six-10 day edges warmer in the Midcontinent compared to [Wednesday], while the East Coast is close to flat.
“Most of the detail challenges revolve around another transient storm system moving across the country next week. The 11-15 day quandary continues this morning with the European favoring a moderate warmth for the middle third of the U.S. and cooler risks toward both coasts. The American and Canadian are stronger with cooler coastal risks, especially on the East Coast…” said Matt Rogers, president of the firm.
Near term doesn’t seem to be much of a challenge at all. The National Weather Service (NWS) forecasts well below normal heating requirements in major energy markets for the week ending Nov. 19. New England is forecast to see 124 HDD (heating-degree-days), or 46 below normal, and the Mid-Atlantic is set to experience 112 HDD, or 44 off its seasonal norm. The greater Midwest from Ohio to Wisconsin should see 106 HDD, or a whopping 72 below normal.
In physical market trading buyers securing incremental supplies for power generation in NEPOOL and PJM were seeing lower next-day power prices as well as weakening loads. Intercontinental Exchange reported on-peak Friday power at ISO New England’s Massachusetts Hub fell $1.47 to $23.31/MWh, and next-day power at the PJM West terminal shed $1.52 to $26.69/MWh.
Deliveries on Texas Eastern M-3, Delivery skidded 35 cents to $1.83, and gas bound for New York City on Transco Zone 6 fell 31 cents to $1.83 as well. Gas at the Algonquin Citygate tumbled 34 cents to $1.91, and packages on Tenn Zone 6 200L dropped 23 cents to $2.05.
Peak power loads were forecast to decline as well. ISO New England reported Thursday’s peak load of 15,800 MW would decline to 15,060 MW Friday and fall further to 14,210 MW Saturday. PJM Interconnection said peak load Thursday of 32,228 MW was anticipated to slide to 31,411 MW Friday before reaching 29,092 MW Saturday.
Major market hubs were also hit with selling. Gas at the Chicago Citygate fell 15 cents to $2.27, and deliveries to the Henry Hub shed 20 cents to $2.33. Packages at Opal changed hands at $2.20, down 18 cents, and gas at the SoCal Citygates came in 16 cents lower at $2.52.
© 2024 Natural Gas Intelligence. All rights reserved.
ISSN © 1532-1231 | ISSN © 2577-9877 |