Markets | NGI All News Access | NGI Data
NatGas Cash Dives; Futures Bears Feeling The Love Following Stout Storage Report
Physical natural gas traders having no desire to subject their deals to the often volatile effects of the 10:30 am EDT release of storage data by the Energy Information Administration (EIA) may have set the stage for a broad market shift lower by both futures and cash markets.
Only one market point followed by NGI made it to higher ground, and the NGI National Spot Gas Average tumbled 17 cents to $2.65. Several points in the volatile Northeast dropped more than $1. Cash traders appeared almost clairvoyant ahead of the EIA storage report as the 77 Bcf reported was about 3 Bcf greater than market expectations. At the close, November had given up 2.9 cents to $3.141 and December held was unchanged at $3.434. November crude oil expired at $50.43/bbl, down $1.17.
Fundamentals traders noting the bin-busting levels of gas storage have been suspicious that the recent futures strength might have been a little too much, too soon, especially with cold winter weather existing only on paper. That suspicion may have played out just ahead of Thursday’s release of inventory data, when it appeared that traders were expecting the upside miss as the November natural gas futures contract began the day trading below Wednesday’s regular session settle. After trading as low as $3.127 prior to the report, November futures notched a $3.112 as the 77 Bcf number ripped across trading screens. A few minutes later, the front-month contract carved out a $3.101 low.
However, after a bit of back-and-forth, November inched higher into the afternoon and was trading at $3.154 at 1 p.m., down only 1.6 cents from Wednesday’s $3.170 regular session close.
Futures traders remained optimistic. “We traded down to $3.10 but ultimately settled up at $3.14. I think today was just traders taking some money off the table,” a New York floor trader told NGI.
Citi Futures Perspective’s Tim Evans called the 77 Bcf build “modestly bearish,” adding that it might be just large enough to dislodge the recent bullish natural gas price momentum.
“The 77 Bcf refill for last week was somewhat more than the 73-74 Bcf consensus expectation and so a minor bearish surprise,” Evans said. “The build was still slightly below the 84 Bcf five-year average and so marginally supportive on a seasonally adjusted basis. Overall, we see the injection as failing to fully support the bullish market narrative, adding to the case for a downward correction.”
Randy Ollenberger, an analyst at BMO Capital Markets, was mostly unimpressed by the report. “We believe the storage report will be viewed as neutral. Storage remains at record levels, but the level of injections is lower than last year and points to a rebalancing over the course of the fall. We believe that U.S. working gas in storage could exit the fall season at five-year average levels, assuming normal weather,” Ollenberger said.
Analysts with Wells Fargo Securities said that while the injection was “slightly above consensus,” they too saw it as “neutral” for the market. “Though not far below last year’s change, this marks the 30th week in a row the storage change has come in below 2015 levels, continuing the relatively slow inventory build throughout the summer and fall,” the analysts wrote in a research note.
With smaller injections during this year’s storage refill season, analysts with Jefferies LLC said natural gas price spikes this winter are certainly in play. “With only two weeks remaining in the ”refill season,’ the storage ”glut’ has largely been abated,” they said. “While storage is in-line with prior year levels, we enter the ”withdrawal season’ this year under very different circumstances. Exports (LNG, Mexico) are likely to be about 1.5-2 Bcf/d higher this winter and supply is down about 2 Bcf/d. We continue to see an imbalanced risk of gas price spikes this winter on even brief cold weather periods.”
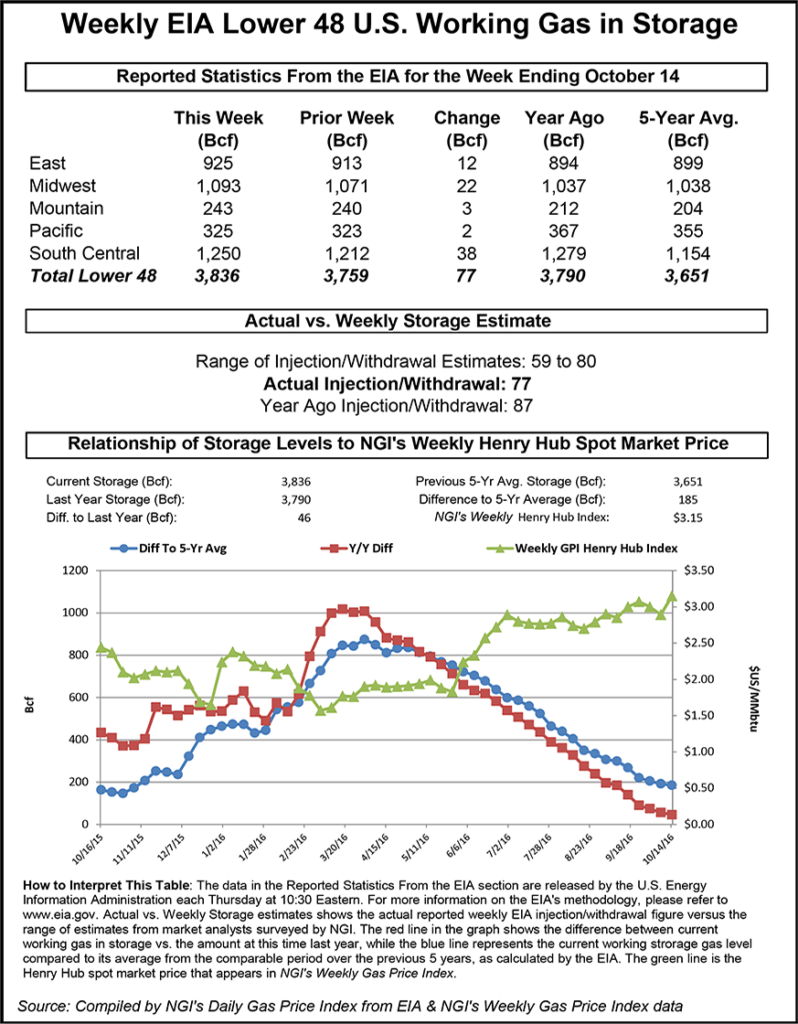
Heading into the report, Evans had been expecting a 72 Bcf build, while PIRA Energy estimated a 71 Bcf increase and Ritterbusch and Associates was looking for a 76 Bcf build. A Reuters survey of 21 traders and analysts revealed an average 73 Bcf injection with a range from 70 to 77 Bcf. The 77 Bcf build fell short of last year’s 87 Bcf injection and the 84 Bcf five-year average build.
Inventories now stand at 3,836 Bcf and are 46 Bcf greater than last year at this time and 185 Bcf more than the five-year average. In the East Region, 12 Bcf was injected, and the Midwest Region saw inventories increase by 22 Bcf. Stocks in the Mountain Region rose 3 Bcf, and the Pacific Region was higher by 2 Bcf.
The South Central Region topped the rest with a 38 Bcf build. Salt cavern storage was up 25 Bcf at 330 Bcf, while the non-salt cavern figure was up 13 Bcf at 920 Bcf.
The addition of 77 Bcf is all well and good and gives the industry a well-supplied cupboard going into the heating season, but the 800-pound questions in the room are what will winter 2016-2017 be like, what is the likely impact on supplies, and most importantly what kind of pricing environment will result?
To answer those questions, analysts Kevin Adler and Robert Applegate of PointLogic Energy constructed three scenarios on varying levels of residential/commercial demand to see what ending inventories might be in spring 2017, and if that would indicate a rebalanced market.
Commodity Weather Group also offered its recent and somewhat more aggressive winter outlook in its recent Energy Seasonal Outlook.
“To accurately project gas demand in the winter, getting the residential/commercial number right is crucial,” Adler and Applegate said. “That’s why PointLogic uses a 330-city temperature model to get accurate, granular information that we feed into our model for how gas demand in different parts of the country reacts to temperature variations.”
Their worst case scenario is for a repeat of winter 2015-2016. “From Oct. 1, 2015, through March 31, 2016, residential/commercial demand averaged 32.6 Bcf, or a total of 4,917 Bcf for the five-month (151 days) period. The average over the last eight years, including last winter, was 36.6 Bcf/d. To put it another way, over the typical 151-day winter season (or 152 days during a leap year), residential/commercial demand on average for the last eight years was about 604 Bcf higher than it was last winter. That figure represents drawdown of inventories that would happen in a typical year but did not occur last winter.” That case, 32.6 Bcf/d, results in ending inventories at 2,372 Bcf, not far off March 2016 at 2,467 Bcf.
From another angle, the 32.6 Bcf/d translates to 3,210 GWHDD (last season’s heating load), according to figures from Commodity Weather Group in its recent Energy Seasonal Outlook.
Using its model and incorporating normal weather and temperature assumptions of the eight-year average PointLogic found this would result in residential/commercial demand of 36.8 Bcf/d, almost 13% greater than the worst case. This calculates to an end-of-March inventory level of 1,698 Bcf.
Commodity Weather Group is forecasting winter GWHDD of 4,031 or 26% higher than last year. Commodity Weather Group did not forecast residential/commercial demand.
A third case, mid-point between the two, showed 34.7 Bcf/d residential/commercial demand and came to an ending inventory of 2,054 Bcf.
Residential/commercial predictions are useful, but PointLogic admits that it cannot predict the weather, and “recent history suggests that temperatures are on the rise — and this is a risk factor that should be taken into account. According to NASA’s Goddard Institute for Space Studies, August 2016 marked the 11th month in a row when worldwide temperatures set a record. These are record temperatures each month, not merely temperatures above average. September looks like it will continue the trend, at least in the U.S.”
However, if either the PointLogic assumptions of an eight-year average winter or the more aggressive Commodity Weather Group forecast are realized, the market should have little trouble avoiding the price collapse that sent spot futures as low as $1.61 in March 2016.
In the physical market New England points led the charge lower with mild, moisture-laden weather conditions pulling the rug out from prompt natgas quotes. AccuWeather.com forecast Thursday’s load-killing rain and thunderstorms in Boston with a high of 63 degrees would rise to 71 Friday, 11 degrees above normal. Similar rain and storms in New York City with Thursday highs of 71 reaching 74 by Friday, 12 degrees above normal, were also forecast.
Gas at the Algonquin Citygate imploded $1.26 to $1.58, and deliveries on Iroquois, Waddington shed $1.09 to $1.85. Gas on Tennessee Zone 6 200L tumbled $1.35 to $1.44.
Declines at other market centers were not quite as intense. Gas bound for New York City on Transco Zone 6 was quoted 9 cents lower at 94 cents and packages at the Chicago Citygate fell 11 cents to $3.07. Gas at the Henry Hub changed hands a nickel lower at $3.09, and deliveries to the PG&E Citygate fell a penny to $3.24.
© 2024 Natural Gas Intelligence. All rights reserved.
ISSN © 1532-1231 | ISSN © 2577-9877 |