November NatGas Forwards Prices Comfortably Above $3 Again as Production Slides Below 70 Bcf/d
While weak natural gas cash prices this week sent production to the lowest level of the year, the rapid drop in supply sent November forward prices up an average 13.3 cents for the period between Sept. 30 and Oct. 6, NGI’s Forward Look data shows.
The double-digit gains were seen across the curve, with even the winter 2017-2018 strip shooting up 12 cents on average, according to Forward Look.
On a national level, December forward prices rose an average 13 cents during that time, and the balance of winter (December to March) picked up an average 14 cents.
The Nymex put up slightly stronger gains as the November futures contract shot up 14.3 cents from Sept. 30 to Oct. 6 to reach $3.049, December futures were up 15 cents to $3.282 and balance-of-winter futures were up 14 cents to $3.370.
The strength in the futures and forwards markets built steadily throughout the week as Thursday marked the fourth straight day of gains for the Nymex.
While longer-term factors such as increasing power burn, growing exports to Mexico and LNG exports appear to be at play when looking at the strength that extended across the curve, the main culprit behind the front-end surge is production.
Supply began the week on a soft note as Spring Rock’s daily pipe estimate had Monday’s volumes just over 70.2 Bcf/d, the lowest since freeze-offs in late December 2015, according to data and analytics company Genscape.
While the Louisville, KY-based company noted that daily revisions are common, low cash prices and prolonged maintenance events appear to have taken their toll on production.
Indeed, production had fallen close to 69 Bcf/d by Thursday as cash prices for next-day delivery in the supply-heavy Northeast fell below $1 at several key pricing hubs.
In Thursday’s trading session, gas on Dominion South dropped to 88 cents, and gas onTennessee Zn 4 Marcellus fell to 80 cents. Gas on Transco-Leidy Line slid to 85 cents, NGI price data shows.
The recent weakness in regional pricing has been due to lack of storage, analysts say.
For example, inventories at TCO are reported to be at 99% of the facility’s 245 Bcf working capacity, while Dominion’s inventories have tightened to within 13 Bcf of its system capacity.
Meanwhile, the storage refill to near maximum levels comes amid little demand in the region.
“That lack of storage space this past weekend combined with the excess gas on the system left no other alternative but to put the daily cash prices at many producing hubs below producer costs,” said Jeff Richter, principal at EnergyGPS, a Portland, OR-based trading and risk management firm. “As a result, we saw cash prints as low as $0.30 across the Marcellus and Utica basins. These multi-year lows had some producers scrambling to shut in their wells as ‘producer’ economics became the lever to pull to help balance the pipeline system” (see Daily GPI, Oct. 6).
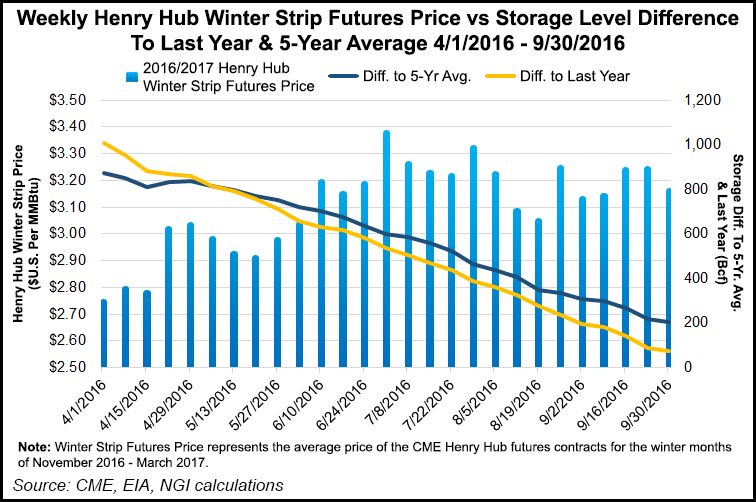
Indeed, robust storage inventories, which in April sat at a more than 1 Tcf surplus over year-ago levels, have been carefully watched by the market all summer.
In fact, it came as a surprise that November futures didn’t respond more soundly to this week’s storage report from the U.S. Energy Information Administration, which reported a much larger-than-expected build to supplies.
EIA reported an 80 Bcf injection to storage stocks for the week ending Sept. 30. Estimates ranged widely from the mid-60s Bcf to the mid-70s Bcf.
“The EIA’s +80 Bcf reported injection was 6 Bcf above our estimate and 9 Bcf above the average of six major surveys,” Genscape said. “It was also completely outside the range of published expectations, coming in 2 Bcf above the highest published estimate (+78 Bcf).”
Compared to degree days and normal seasonality, a +80 Bcf appears tight by approximately 2.2 Bcf/d versus the prior five-year average, the company said.
Overall degree days were close to the five-year average for the week, with CDDs falling by 22 and gas-weighted HDDs increasing by 10 week over week. Gas demand for power burn fell by approximately 34 Bcf week over week, driven by a large overall decline in loads (down about 35 AGWH w/w) due to the large week-over-week decline in cooling demand, Genscape said.
U.S. working gas in storage is now at 3,680 Bcf, which is 2.1% above last year’s level of 3,606 Bcf and 5.9% above the five-year average of 3,475 Bcf.
The market will now turn its attention to next week’s report, which is once again expected to be a whopper.
“Next Thursday’s storage report will be interesting, since there is a possibility we could see the surplus to last year expand for the first time since the week ending April 2,” analysts at Mobius Risk Group said.
Preliminary data for the current week (corresponding to the EIA report on Oct. 13) indicate an injection between 75-85 Bcf, which would push inventories back above prior seasonal highs, Mobius said.
“Based on current fundamental conditions, the following week’s (EIA report for Oct. 20) weather forecast also suggests expansion versus prior seasonal highs,” the Houston-based company said.
Indeed, weather conditions aren’t expected to bring about any significant cooling or heating demand over the coming week. While a weather system is expected to lower temperatures in the central and eastern U.S., demand is expected to increase only modestly and then gradually return to more seasonal levels shortly thereafter, forecasters with NatGasWeather said.
Meanwhile, the southern United States into California remains warm with highs in the 80s to near 90 degrees F, resulting in light cooling demand, but still not exceptionally strong, the forecaster said.
“Weather systems are expected into the Northwest and East after next week, but still not quite cold enough to intimidate as we wait on more impressive Canadian blasts to arrive later in the month,” NatGasWeather said.
To be sure, the weather group agreed next week could bring about the largest storage build of the year, but said it would still come in slightly below the five-year average of +92 Bcf.
Cooler temperatures are expected to show up after Oct. 18, thus increasing demand late in the medium-range outlook, but the market will have to wait a bit longer for frigid cold, NatGasWeather said.
Once cold weather does arrive, however, the market can expect this winter to be significantly colder than last, according to several forecasters.
For its part, the National Oceanic and Atmospheric Administration said this winter is expected to be 12% colder than the winter of 2015-2016.
It is important to note, however, that last winter was the second-warmest on record.
“Prices held up well this week with less than impressive weather patterns and a bearish storage report. Therefore, it’s important to see how prices react going into today’s close as the front contract again sits near $3,” NatGasWeather said.
Indeed, the November futures contract was up nearly 15 cents by midday as traders continued to ride the momentum following Thursday’s bearish storage report.
Meanwhile, Hurricane Matthew hit the east coast of Florida early Friday as a category 3 storm and is on track to move north along the East Coast as far as North Carolina over the weekend, potentially bringing torrential rainfall, storm surges and flooding to the region.
Because of the storm’s proximity to the coast, high winds, rainfall, and flooding will potentially affect electricity infrastructure such as power transmission and distribution lines, EIA said.
“Although there are no petroleum refineries or natural gas processing plants along the East Coast from Florida to Maryland, some product terminals could be affected, potentially reducing energy imports,” EIA said on its website Friday.
Governors in Florida, North Carolina, South Carolina, Georgia and Virginia have declared states of emergency in advance of the storm’s arrival.
It has been more than a decade since a hurricane rated Category 3 or higher has made landfall in the United States. Hurricane Sandy, the last major hurricane to affect this region, was a Category 1 storm by the time it made landfall in New Jersey in October 2012.
© 2024 Natural Gas Intelligence. All rights reserved.
ISSN © 2577-9915 | ISSN © 2577-9877 |