September NatGas Bidweek Features Solid Gains, But Traders Skeptical
September natural gas bidweek bulls regained some of their footing following August Bidweek’s 23-cent setback to $2.43. It wasn’t quite the same as July’s 86-cent surge, but the NGI September 2016 National Bidweek Average rose 8 cents to $2.51, which coincidentally is 8 cents higher than the September 2015 average of $2.43.
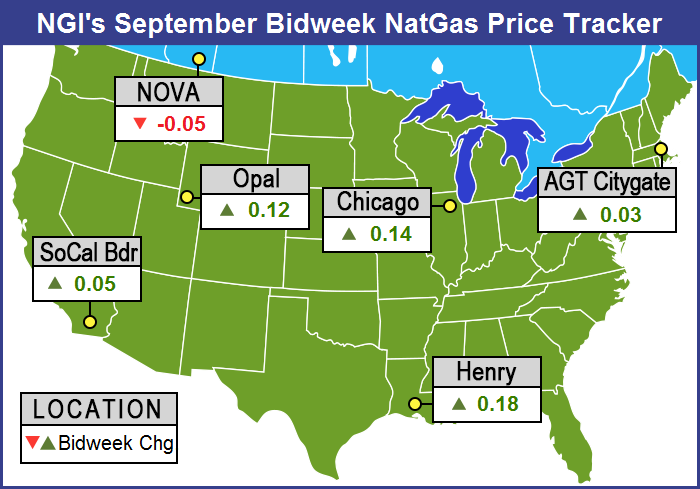
Outside the Northeast solid, double-digit gains were seen in the Midwest, Midcontinent and Gulf. Of the actively traded points Dawn scored the biggest gain with a 29-cent advance to average $2.90. Bidweek’s greatest losses were recorded at Transco Zone 6 non-NY North and Transco Zone 6 New York, which came off by 45 cents and 44 cents, respectively, to the same $1.48 average. Only two U.S. regions, Appalachia with a 2 cent decline to $1.40 and the Northeast with a 28-cent loss to $1.94, failed to make it to the positive side of the trading ledger.
Regionally, California posted an 8-cent gain to $2.88 and the Midcontinent, Rocky Mountains and East Texas were 10, 12, and 13 cents higher at $2.65, $2.60 and $2.78, respectively.
Higher up the regional food chain, South Texas gained 16 cents to average $2.78, while South Louisiana added 18 cents to $2.80. The Southeast and Midwest both made 20-cent jumps to $2.81 and $2.82, respectively.
September futures settled at $2.853, a stout 18.1 cents over the August settlement. That difference has some traders thinking the market is headed lower.
“I don’t think we will cross $2.97,” Alan Harry, director of trading at McNamara Options in New York, told NGI Friday.
“There is a lot of bullish pressure in the market right now, but in the end there are enough producers and enough natural gas in the marketplace along with Canada and U.S. producers. It’s going to be difficult to keep the market up.
“We had a settlement in August of $2.672 and that’s when you have all the cooling going, and September comes off the board on Monday. Is September going to be warmer than August? Probably not. Are we going to have less natural gas flowing into the system? Probably not. It’s difficult to see the cash price supporting that.
“Let’s say that September settles Monday in the $2.80 to $2.90 range, so it sounds like anyone buying into that is going off some sort of damage from a hurricane or some outage, or something like that. If we don’t get that, and it seems likely based on the models, then it’s going to be difficult to support natural gas at much higher levels.
“Short term, I think we make a rally to $2.88 to $2.94, and after that we back off. We got to that range today so it looks like we are close to a top and have downside [risk] for natural gas.”
Bidweek buyers had only nominal interest in purchases. “We bought a little bit and did it late in the week,” said a Midwest utility buyer. “We try to buy index and ended up paying a premium because there wasn’t any index gas out there.
“We bought on the closing day, and the locations we were buying at were doing fixed-price only so there is less liquidity in the market. At the time there were only offers and they knew they were the only one out there offering so they offered at a pretty good price.”
Other buyers were content with their bidweek purchases. “We did reasonably well,” said a Michigan marketer. “We ended up with a negative 2-cent basis on Michcon, and that took the price down to $2.833.
“We also had a positive $0.005 basis on one Consumers purchase and a positive $0.030 basis on another. The basis wasn’t bad but in the general scheme of things prices weren’t as good as they were last year.
“We pretty much did our normal volumes because we just don’t know what is going to happen.”
As bidweek drew to a close Wednesday financial and physical natural gas moved in opposite directions for Thursday deliveries. Few points made it to the plus side of the trading ledger, and most locations were off by a nickel or more.
Moderating temperature trends along the Eastern Seaboard, along with soft power prices, forced next-day Northeast gas prices into double-digit losses, and the NGI National Spot Gas Average fell 8 cents to $2.63.
Futures were able to recover most of Tuesday’s 7-cent setback, and at the close October had gained 6.0 cents to $2.887, and November had risen 5.4 cents to $3.003. October crude oil continued to struggle, posting its third straight loss for the week with a drop of $1.65 to $44.70/bbl.
Eastern prices softened as temperatures were forecast to trend to the mild side. AccuWeather.com predicted that Wednesday’s high in Boston of 84 would slide to 79 Thursday and to 75 Friday, 2 degrees below normal. New York City’s Wednesday peak of 86 was expected to fall, along with rain, to 79 Thursday and Friday. The normal high in New York this time of year is 80.
Gas at the Algonquin Citygate for Thursday delivery tumbled 34 cents to $2.84, and deliveries to Iroquois, Waddington fell 13 cents to $2.96. Gas on Tenn Zone 6 200L shed 33 cents to $2.79.
Gas on Transco Zone 6 NY dropped a stout 35 cents to $1.39, and packages on Texas Eastern M-3, Delivery were off 12 cents to $1.27.
Weak power prices also left their imprint. Intercontinental Exchange reported on-peak power at the ISO New England’s Massachusetts Hub fell $8.88 to $31.50/MWh, and on-peak deliveries to the PJM West terminal skidded $5.90 to $29.82/MWh.
California next-day gas also fell victim to a weak power environment. Intercontinental Exchange reported next-day power at NP-15 retreated $3.71 to $35.71/MWh, and SP-15 skidded $3.44 to $35.50/MWh.
Gas on PG&E shed 6 cents to $3.37, and gas at the SoCal Citygate was off 10 cents to $2.98. Packages priced at the SoCal Border Avg. changed hands 13 cents lower at $2.84, and Kern Delivery came in at $2.84, down 18 cents.
Wednesday’s advance has some traders skeptical the market can breach $3.00, but Tuesday’s decline had more to do with trader dynamics than fundamental factors. According to Tim Evans at Citi Futures Perspective, the 7-cent decline was prompted by “profit-taking after prices failed to clear Friday’s high. A slightly cooler 11-15 day temperature forecast may have encouraged selling, although we note that 346 MMcf/d of natural gas production from the Gulf of Mexico (GOM) was shut in as a precaution due to Tropical Depression No. 9, nearly double Monday’s outage.”
The tropical storms affecting the GOM and East Coast may not seem like much, but gas production was getting shut in nonetheless.
According to the Bureau of Safety and Environmental Enforcement estimates on Thursday, oil and gas production in the GOM was already ramping back up. The agency estimated that 242,836 b/d, or 15.18% of the current oil production in the GOM was shut in (down from 22.06% on Tuesday), and 307 MMcf/d, or 9.03% of natural gas production (down from 10.18% on Tuesday).
Offshore operators evacuated platforms and rigs in the path of upgraded Tropical Depression (TD) 9, renamed Tropical Storm Hermine. The National Oceanic Atmospheric Administration said the storm system was becoming more organized as it issued tropical storm and hurricane watches for areas of the GOM. The system was moving northwestward and was forecast to hit the northwestern Florida coast by Thursday.
The Thursday Energy Information Administration (EIA) storage report for the week ending Aug. 26 hinted at big changes ahead in a storage dynamic which until recently had been characterized by subpar builds and contracting storage surpluses.
Natural gas futures took a hit after the EIA reported a storage injection that was greater than what traders were expecting. EIA reported a 51 Bcf storage injection in its 10:30 a.m. EDT release on Thursday, about 10 Bcf greater than what traders and analysts were expecting, and outside of the consensus 30 Bcf to 48 Bcf injection range. October futures reached a low of $2.790 immediately after the figures were released, but by 10:45 a.m. September was trading at $2.809 down 7.8 cents from Wednesday’s settlement.
“The 51 Bcf build in U.S. natural gas storage for last week was more than expected and a significant step up from the smaller than expected 11 Bcf refill in the prior week,” Evans said. “The gain was still less than the 68 Bcf five-year average rate and so does confirm a further tightening of the market on a seasonally adjusted basis, but the data implies a weaker overall balance in the market than had been thought.”
While injections and draws completely outside the range of expectations are infrequent, they do happen, according to Nathan Harrison, NGI markets analyst. “Since NGI began tracking these data in December 2013, expectations beat/misses have occurred 23 times. The Nymex futures response is generally pretty large on the day but has ranged from $0.005 to $0.45 on an absolute basis. On average, these events tend to generate a move of about 9.1 cents in the prompt Nymex futures price on the regular session close of the day the news is priced in. The median of these events is a 6.4-cent move.”
Inventories now stand at 3,401 Bcf and are 238 Bcf greater than last year and 334 Bcf more than the five-year average. In the East Region 21 Bcf was injected, and the Midwest Region saw inventories increase by 29 Bcf. Stocks in the Mountain Region rose 3 Bcf, and the Pacific Region was unchanged. The South Central Region dropped 2 Bcf.
© 2024 Natural Gas Intelligence. All rights reserved.
ISSN © 1532-1258 | ISSN © 2577-9877 |