NGI The Weekly Gas Market Report | E&P | Infrastructure | NGI All News Access
U.S. NatGas Production Down Slightly in May, Consumption Up, EIA Says
U.S. natural gas production and dry gas production in May were both lower — barely — compared with the same month last year, according to the Energy Information Administration (EIA), while gas consumption edged higher.
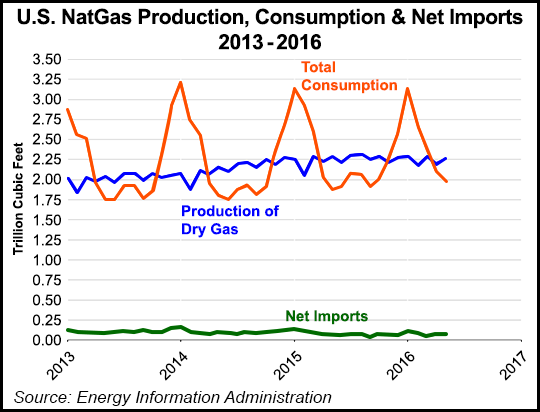
Total U.S. natural gas production in May was 2.77 Tcf (89 Bcf/d), down marginally from May 2015, and dry gas production reached 2.26 Tcf (73 Bcf/d), compared with 2.28 (74 Bcf/d) in May 2015, EIA said in its latest Natural Gas Monthly report.
Last month, EIA said April dry gas production was lower year/year — the first year/year decrease for the month of April since 2006 (see Daily GPI, July 1).
But total production (13.76 Tcf) and dry gas production (11.24 Tcf) through the first five months of 2016 still outpaced the first five months of 2015 (13.59 Tcf, 11.12 Tcf) and 2014 (12.78 Tcf, 10.32 Tcf), EIA said. Several production records were set last year, and the 2015 total ballooned to 27.09 Tcf, a 5.3% increase compared with 25.73 Tcf in 2014 (see Daily GPI, March 1).
Total production increased compared to May 2015 in only four states — Alaska (269.20 Bcf, compared with 261.38 Bcf in May 2015), Colorado (144.27 Bcf, compared with 140.19 Bcf), Ohio (121.61 Bcf, compared with 77.87 Bcf) and Pennsylvania (441.15 Bcf, compared with 385.25 Bcf). Production was virtually unchanged in North Dakota (50.28 Bcf in May, compared with 50.22 in May 2015).
The list of states reporting production decreases in May compared with the same month last year included Arkansas (71.75 Bcf, compared with 89.20), California (18.14 Bcf, compared with 18.73 Bcf), Kansas (21.90 Bcf, compared with 25.37 Bcf), Louisiana (157.03 Bcf, compared with 162.93 Bcf), Montana (4.44 Bcf, compared with 5.00 Bcf), New Mexico (108.79 Bcf, compared with 111.62 Bcf), Oklahoma (212.62 Bcf, compared with 214.64 Bcf), Texas (696.90 Bcf, compared with 743.98 Bcf), Utah 31.80 Bcf, compared with 38.57 Bcf), West Virginia (114.05 Bcf, compared with 120.14 Bcf) and Wyoming (148.47 Bcf, compared with 160.71 Bcf).
The Federal Gulf of Mexico (108.80 Bcf, compared with 116.25 Bcf) and EIA’s Other States category (47.99 Bcf, compared with 48.32 Bcf) also reported declines.
Consumption of dry natural gas in May was 1.99 Tcf (64.3 Bcf/d), a 6.2% increase compared with 1.88 Tcf in May 2015. The 12.29 Tcf total for the first five months of 2016, however, remains below totals for the first five months of 2015 (12.60 Tcf) and 2014 (12.32 Tcf).
Electric power deliveries in March were 807 Bcf (26.0 Bcf/d), a 9.2% increase from 23.8 Bcf/d in May 2015. Industrial deliveries were 617 Bcf (19.9 Bcf/d), a 2.8% increase from May 2015 and the highest for the month since EIA began tracking sectoral totals in 2001. Deliveries to residential consumers were also up, to 197 Bcf, (6.4 Bcf/d), a 9.4% increase from May 2015, and commercial deliveries were also up, to 171 Bcf (5.5 Bcf/d), a 5.5% increase from May 2015.
Net imports of natural gas were 71 Bcf in May, compared with 70 Bcf a year ago.
© 2024 Natural Gas Intelligence. All rights reserved.
ISSN © 1532-1231 | ISSN © 2577-9877 | ISSN © 1532-1266 |