NGI Data | Markets | NGI All News Access
NatGas Cash Left in Dust by Soaring Futures; September Adds 21 Cents
Physical natural gas for Friday delivery and futures markets parted company in Thursday’s trading.
Physical traders, especially in the Northeast, only had to look at Friday’s temperature forecasts and next-day power prices to see little incentive for incremental purchases. The NGI National spot gas average dropped 8 cents to $2.53, but declines in the Northeast averaged more than a half dollar. Relative strength in Texas, the Midwest, Midcontinent and South Louisiana were no match for the lower quotes posted in New England and the Mid-Atlantic.
Futures bulls responded gleefully to an Energy Information Administration (EIA) storage report that showed an anemic storage build of just 17 Bcf, well below market expectations and well below historical averages. By the close, September had tacked on 21.3 cents to $2.873 and October was higher by 20.0 cents to $2.909. September crude oil spiraled lower by another 78 cents to $41.14/bbl.
Friday temperature forecasts at major market centers were all sellers needed to keep prices submerged. Forecaster Wunderground.com predicted that Boston’s Thursday high of 92 degrees would plunge to 76 Friday before recovering to 82 by Saturday, the seasonal average. New York City’s high of 92 Thursday was expected to be followed by Friday’s high of 80 before making it back to 84 on Saturday, the seasonal average.
Friday gas at the Algonquin Citygate fell 74 cents to $2.21, and deliveries to Iroquois, Waddington skidded 14 cents to $2.64. Gas on Tenn Zone 6 200L lost 77 cents to $2.16.
Packages destined for New York City on Transco Zone 6 dumped 73 cents to $1.66, and gas on Tetco M-3 changed hands 9 cents lower at $1.35.
Next-day power prices were also lower. Intercontinental Exchange reported that on-peak power for delivery to ISO New England’s Massachusetts Hub Friday fell $17.01 to $35.10/MWh and on-peak power at the PJM West Terminal dropped $5.45 to $33.93/bbl.
At some point, lower prices will be colliding with lower production. “Lower 48 dry gas production is off more than 0.5 Bcf/d DOD with large declines in the Gulf of Mexico, Texas and the Rockies,” said industry consultant Genscape in a Thursday report. “Spring Rock’s Daily Pipe Production estimate has today’s volume at 71.8 Bcf/d. GOM production is down more than 0.2 Bcf/d DOD due to offshore losses. Destin receipts from Delta House are down to 74 MMcf/d, a 132 MMcf/d drop from yesterday and the prior 30-day average.
“Evening noms to Transco from Tubular Bells are also off, coming in at 9 MMcf/d after having averaged 47 MMcf/d in the past 14 days. Elsewhere, Texas estimated production is down 148 MMcf/d DOD, and Rockies volumes are off 103 MMcf/d DOD with declines showing in every basin but the Uinta.”
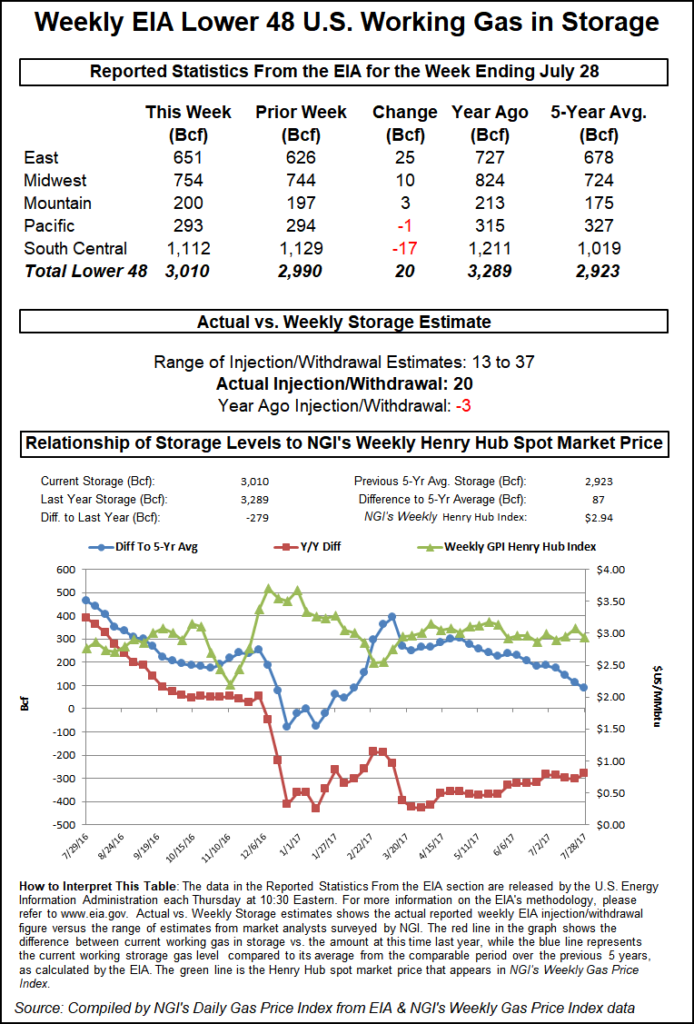
Traders Thursday expected to get an idea of just how much recent widespread heat has affected supplies with the 10:30 a.m. EDT release of inventory statistics from the EIA. Current thinking was that the build would be less than 30 Bcf, and perhaps the lowest July build since 2010.
When EIA reported a 17 Bcf storage injection, about 9 Bcf less than what traders and analysts were calculating. September futures bounded higher and reached a high of $2.816 immediately after the figures were released and by 10:45 a.m. September was trading at $2.811 up 13.9 cents from Wednesday’s settlement.
“We were hearing a number from 24 to 28 Bcf and 26 Bcf was kind of the average,” a New York floor trader told NGI. “That number coming out so low gave confidence to anybody who was long, and anybody who got caught short got burned.”
Analysts were pointing at a miscalculation of power burn. “The smaller than expected 17 Bcf net injection for last week was less than expected and bullish compared with the 52-Bcf five-year average for the date,” said Tim Evans of Citi Futures Perspective. “It was a second consecutive bullish miss, adding to the likelihood that power sector demand has been more sensitive to summer heat than anticipated, something that will likely carry over into the data for the next few weeks.”
Others were more animated. “Are you kidding me?” said John Sodergreen, editor of The Desk weekly storage survey. “There was some serious activity going on in South Central, but Midwest was about par. The South Central was a greater draw than anyone expected and it’s a situation where there is a lack of transparency and nobody knows what the hell is going on.”
Inventories now stand at 3,294 Bcf and are 436 Bcf greater than last year and 524 Bcf more than the five-year average. In the East Region 18 Bcf was injected and the Midwest Region saw inventories increase by 14 Bcf. Stocks in the Mountain Region rose 3 Bcf, and the Pacific Region was unchanged. The South Central Region, however, fell 18 Bcf.
Tom Saal, vice president at FCStone Latin America LLC, in his work with Market Profile identified trading targets based on certain levels of price action. The first trading objective is for the market to test Wednesday’s value area at $2.713 to $2.679, but beyond that Saal identifies the initial balance at $2.713 to $2.679. The week’s storage report often provides a catalyst for prices to break out of the initial balance and reach trading targets both higher and lower. An upward breakout from the initial balance would look for an objective of $2.767 and a downward break has an objective of $2.584.
© 2024 Natural Gas Intelligence. All rights reserved.
ISSN © 1532-1231 | ISSN © 2577-9877 |