Markets | NGI All News Access | NGI Data
NatGas Cash, Futures Glide Lower Following Storage Report
Physical gas for Friday delivery slipped in Thursday’s trading as traders for the most part elected to get deals done before the 10:30 a.m. EDT release of government inventory data.
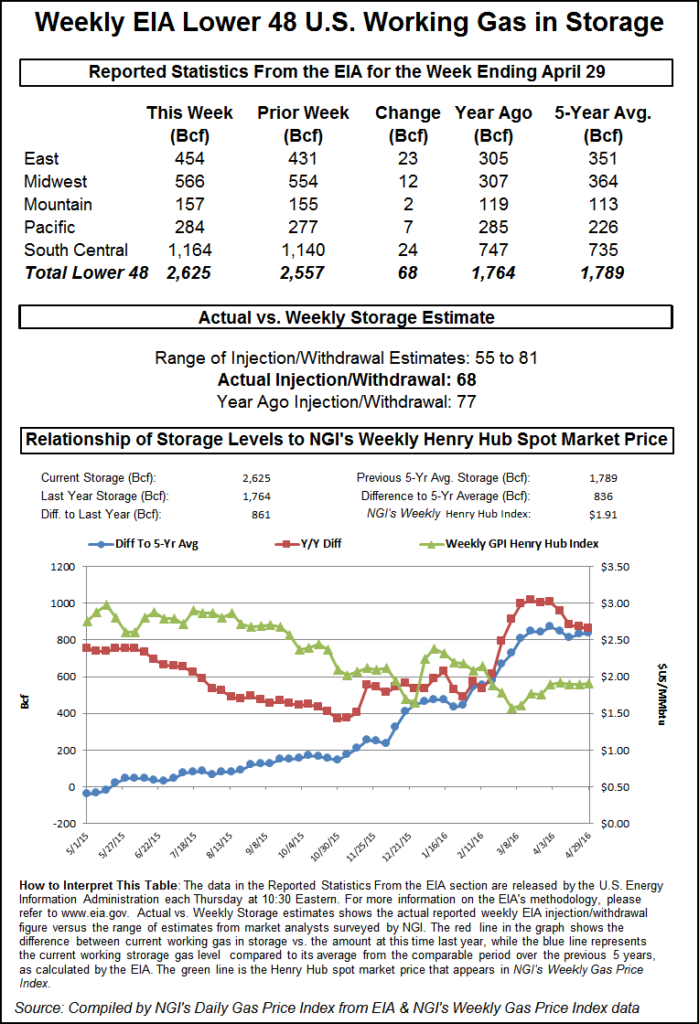
Relative strength in the Rockies and California was unable to offset broader declines in the Northeast, Midwest and elsewhere. The NGI National Spot Gas Average fell 6 cents to $1.90. The Energy Information Administration (EIA) reported a build of 68 Bcf, slightly more than what traders were expecting, and upon release of the data June futures slipped to the lows of the session.
At the close, however, June had fallen more and settled 6.5 cents lower at $2.076, and July was off by 5.8 cents to $2.238. June crude oil added 54 cents to $44.32/bbl.
Only a handful of points managed to escape the selling scythe, but one notable exception was physical gas at the Henry Hub, the delivery point for futures contracts. Producers of physical gas with access to the Henry Hub are able to deliver gas against the sale of futures contracts, which can sometimes deviate significantly from the price of the underlying physical gas.
Apparently the differential between the futures and physical gas just became too tempting. On May 4, according to NGI data, Henry Hub physical averaged $1.99 yet the June futures settled at $2.141. Thus a trader could buy physical gas and at the same time sell futures for what amounts to a quick gain of more than 15 cents.
“I’m sure they are doing that where they can,” a pipeline industry veteran said. “One factor would be storage, for the gas purchased May 4 would have to be stored until the expiration of the June futures May 26.
“Some of the salt storage around the Henry Hub can go in and out on a daily basis,” he said.
The doors of opportunity closed quickly. NGI shows the Henry Hub cash price at $2.04 Thursday, but June futures settled only slightly higher at $2.076.
Other market centers were mostly lower. Gas at the Chicago Citygate fell 7 cents to $2.02, and deliveries on Transco Zone 4 changed hands 4 cents lower at $1.93. Parcels on El Paso Permian shed 4 cents to $1.89, and gas priced at the SoCal Citygate was unchanged at $2.16.
In futures trading the main price driver was the release of storage data. Analysts were expecting a build of about 64 Bcf, but the actual increase of 68 Bcf put the bulls on the defensive.
“I was looking for a 64 Bcf number, and I think the numbers that were out were anywhere from 52 Bcf to 74 Bcf,” a New York floor trader told NGI. “I think $2 is a good support level. If we break $2 we may see another 10 cents down. If it stays above $2 for another couple of days, it should rally.”
“The 68-Bcf net injection for last week was somewhat more than the consensus expectation and above the 64-Bcf five-year average, and so we’d rate it as a minor bearish surprise,” said Tim Evans of Citi Futures Perspective. “As it is simply difficult to forecast the precise impact on storage from temperatures at a time of year when neither heating nor cooling loads are strong or consistent, we don’t think the data should have much impact on the forward outlook.”

Inventories now stand at 2,625 Bcf and are a robust 861 Bcf greater than last year and 836 Bcf more than the five-year average. In the East Region 23 Bcf was injected, and the Midwest Region saw inventories increase by 12 Bcf. Stocks in the Mountain Region rose 2 Bcf, and the Pacific Region was higher by 7 Bcf. The South Central Region added 24 Bcf.
Going into the report analysts were worried about the gyrations between weekly builds and draws. “One of the data points we run each week…is a comparison of the last four report tallies this year against the five year average,” said John Sodergreen, editor of Energy Metro Desk (EMD). “The past four reports have run: +73; +7; -3 and +12 Bcf against the five-year average of, +52; +45; +22 and -19 Bcf. Last year’s numbers were even screwier.
“That said, this week promises to somewhat match the five-year average, for a change, but comparisons to last year continue to be skewed. Last week EIA published a 73 Bcf build, which was way over the five-year average 52 Bcf build, but less than last year’s 84 Bcf (adjusted) build.”
Sodergreen’s EMD survey revealed an average 67 Bcf, about in line with other estimates. IAF Advisors calculated a 67 Bcf increase also, and ICAP Energy was looking for a 69 Bcf increase. A Reuters survey of 21 traders and analysts revealed a 64 Bcf mean with a range of 55 to 72 Bcf. Last year 77 Bcf was injected, and the five year average stands at 64 Bcf.
Gas buyers for daily packages Thursday looked to have their hands full as in some locations temperatures were forecast to be well above seasonal averages. The National Weather Service said in a Thursday morning report, “Well above average temperatures will expand eastward from the northern Rockies and northern plains into the Upper Midwest [Thursday] as high pressure aloft holds strong overhead. Afternoon high temperatures in these areas are forecast to be 15 to 30 degrees above average — with temperatures nearing 90 degrees for some.”
Further out, forecasters are expecting modest weather-driven demand. Natgasweather.com said in a noon update “The latest weather data hasn’t brought any surprises with just one more day of slightly stronger than normal natgas demand due to a weather system tracking through the Mid-Atlantic and Northeast, but then a mostly mild pattern this weekend and next week. Overnight temperatures over the eastern U.S. will drop into the 40s for another night, locally 30s, which isn’t very cold, but still enough to bring a minor bump in demand.
“A Pacific weather system is also tracking into the West Coast with heavy showers and modest cooling, including all of California. National natgas demand will be decreasing after Friday morning to relatively light levels through next week as high pressure gains territory over many regions of the country, resulting in temperatures mainly in the 60s and 70s north, with 70s to mid-80s south.”
© 2024 Natural Gas Intelligence. All rights reserved.
ISSN © 1532-1231 | ISSN © 2577-9877 |