NGI Archives | NGI All News Access
Bulls, Bears At A Standoff In Holiday-Shortened Weekly Natgas Trading
At first glance trading for the holiday-shortened week ending March 24 was a lackluster affair, but the reality provided ample fodder for both market bulls and bears. The NGI Weekly Spot Gas Average fell all of a penny to $1.64, and most market points moved within a penny or two of unchanged. Market bears could relax knowing that the stout 19-cent weekly gain recorded the week before enjoyed no followthrough, and market bulls could continue anticipating the rebalancing of the market via lower supplies, higher pipeline exports, and LNG shipments.
The market point with the week’s largest gains was the NGPL Midcontinent Pool, up 5 cents to average $1.64. The greatest loss was sustained at the Algonquin Citygate, down 55 cents to $1.48.
Regionally the Northeast endured the greatest setback losing 8 cents to $1.36, and California and the Midcontinent enjoyed the greatest gains rising all of 2 cents to $1.76 and $1.67, respectively.
East Texas shed 2 cents to average $1.73 and the Midwest and South Louisiana both lost a penny to $1.82 and $1.73, respectively.
South Texas was unchanged at $1.73 and the Rocky Mountains added a penny to average $1.55.
Over the four-day trading week ending Thursday, April futures lost 10.1 cents to $1.806. In Thursday’s trading physical natural gas values for gas delivery Friday through Monday fell as traders scrambled to get deals done before the late-morning release of storage data by the Energy Information Administration (EIA).
Heading into the holiday weekend, losses of more than a dime, on average, at Midwest points were cushioned somewhat by relatively stronger performances in the Northeast and Midcontinent. The NGI National Spot Gas Average gave up 7 cents to $1.59, and points in the East, on average, slipped a couple of pennies.
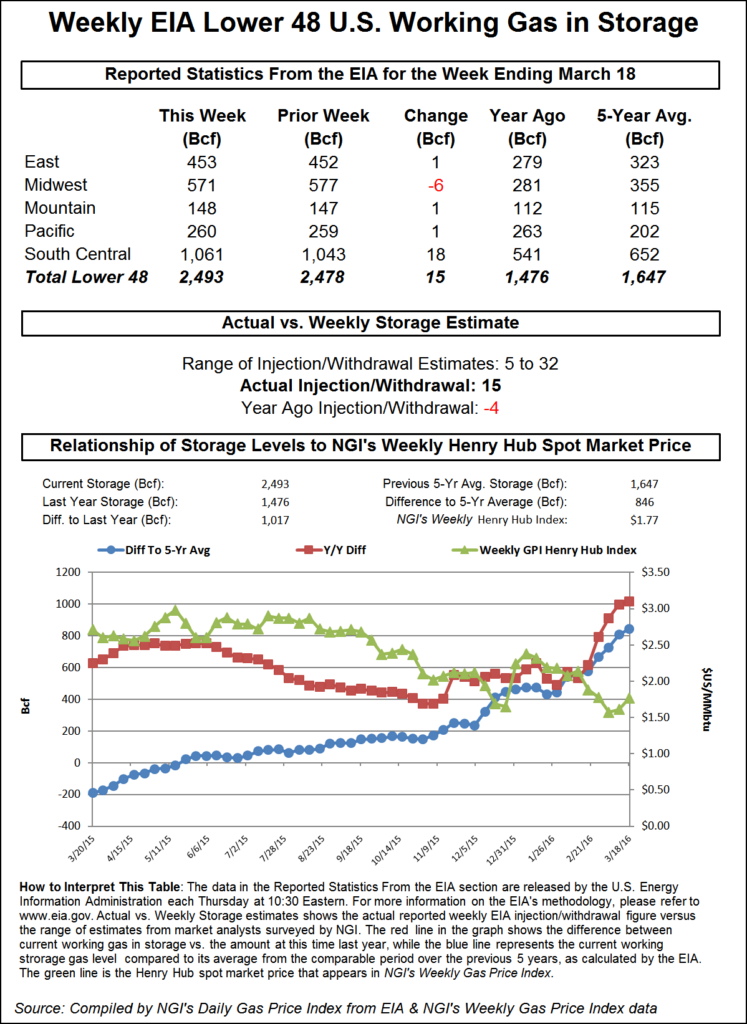
The EIA reported the season’s first storage build for the week ending March 18, with an increase of 15 Bcf, about 5 Bcf less than expectations, but traders were less than impressed. April futures managed to hold on to modest gains made after the number was released, and at the end of the day April settled up 1.2 cents to $1.806 and May had added 1.4 cents to $1.882. May crude oil continued its voyage under $40 and lost 33 cents to $39.46/bbl.
The market volatility historically associated with the release of natural gas storage data is somewhere between slim and none, with slim having just left town. Once the number crossed trading screens, the market rose to a high of $1.807, and by 10:45 a.m. EDT April was trading at $1.804, up 1.0 cents from Wednesday’s settlement.
Going into the report, traders were looking for the first build of the season. With estimates swirling around a 20 Bcf build, that surplus was expected to grow.
Ritterbusch and Associates estimated a 14 Bcf build, and ICAP Energy calculated a 20 Bcf increase. A Reuters poll of 22 traders and analysts revealed a 20 Bcf average with a range from +5 Bcf to + 32 Bcf. Last year, 4 Bcf was withdrawn, and the five-year pace stands at a 24 Bcf decline.
“Traders were expecting 18 Bcf, but I think market sentiment is still bearish,” a New York floor trader told NGI. “The market is short, so any time you see a blip, it is money being taken off the table, not new long-term positions.”
“For the third week in a row, the EIA announced data that has come almost perfectly in line with our expectations,” said Harrison, NY-based Bespoke Weather Services. “Again, this week we have seen the number come in slightly more bullish than the market expectation, but the immediate reaction has been relatively neutral. A +15 Bcf build is still bearish compared to the five-year average of -22 Bcf, but at least the build is smaller than the massive 2012 one.”
Analysts with a somewhat longer-term view also see covering of short positions as a major market driver. For a market advance to continue, traders said entrance of new long positions is critical, rather than the contracting open interest associated with covering existing short positions.
“Market net short positioning has been falling over the last few weeks, reaching its smallest since August 2015 in week ended 21 March,” said analyst Breanne Daugherty with Societe Generale in New York. “This aligns with the price strengthening trend observed over that time period (rising 30 cents between 3 March and 17 March). The market removed some support [Wednesday], settling down nearly 7 cents on the day; but today’s slightly bullish storage report seemingly stopped that downward trend headed into a long weekend. The 15-day weather outlook is a bit more supportive than what the market has been used to this winter, but the demand impact is limited.
“It is important to remember that, as March transitions into April, below-normal temperature expectations have much less of an impact. We expect the market will start the injection season very near the record set in 2012 (2.5 Tcf). Harnessing in the injection pace in April through June will be critical in order to establish confidence in a manageable trajectory and reduce the risk of storage containment pressure emerging by the end of October. This is why we see price risk weighted to the downside in the weeks ahead. Storage working capacity is basically unchanged from last year, estimated at 4.25 Tcf.”
Societe Generale is forecasting a May Henry Hub physical price of $2.20 and June at $2.35.
Weather models Thursday fluctuated, with near-term moderation giving way to cooling. Commodity Weather Group in its Thursday morning report said, “It has been a trend nearly this entire week to see the six-10 day edge warmer and then see a stronger cooler to colder pattern loom in the 11-15 day. [Thursday’s] changes were slightly warmer again for the Midwest to South inside the six-10 day, while slightly cooler in the West. The incoming cooler to colder surge for the Midcontinent is finally reaching days nine-10 and should dominate the six-10 day by Sunday’s update; however, with its current half-steps forward, we may continue to see same-day demand losses as it progresses forward.
“The cool to cold push appears impressive in the early 11-15 day for the Midwest and then East — even on the European guidance — but then we see more evidence of undercutting Pacific flow that should aim to warm the pattern as we head toward the second week of April,” said Matt Rogers, president of the firm.
All indications are that Texas facilities won’t be seeing much in the way of injections for a while. According to industry consultant Genscape, data is indicating that Texas’ “combined inventory currently stands at approximately 695 Bcf, the highest March inventory in history. Texas inventory for March 2016 will come in close to 46 Bcf higher than in March 2012. At each of the seven facilities monitored, activity has either stagnated or transitioned to steady injections over the past few weeks.
“The summer months will likely prove to be relatively lethargic as overall injections should amount to less than half of those seen last year.”
In physical market trading for Friday through Monday delivery, near-term temperature outlooks in major population centers kept a tight lid on prices. AccuWeather.com forecast that Thursday’s high in New York City of 54 degrees would reach 66 Friday before backing off to 56 Saturday, still 3 degrees above normal. Chicago’s high Thursday of 40 was seen rising to 43 Friday and 54 by Saturday, 4 degrees above normal.
Gas in and around the Great Lakes tumbled. Deliveries to Alliance shed a dime to $1.78, and packages at the Chicago Citygate lost 11 cents to $1.79. Gas on Consumers changed hands 14 cents lower at $1.77, and parcels on Michigan Consolidated fell 12 cents to $1.81. Gas at Joliet gave up a dime to $1.78.
Major market hubs were somewhat more resilient. Gas on Dominion South shed a nickel to $1.10 and packages at the Henry Hub fell 8 cents to $1.72. Gas on Kern River was quoted 4 cents lower at $1.57 and gas at the PG&E Citygate fell 11 cents to $1.90.
In Wednesday’s trading physical gas for Thursday delivery worked higher as firm quotes in the Gulf, Texas, and Northeast were able to offset a weaker Rockies and flat California. The NGI National Spot Gas Average rose 3 cents to $1.67 and eastern points were able to tack on about 7 cents on average. After early gains futures prices turned tail and ended up with losses on the day as traders cited some spillover from a weak petroleum complex. April settled 6.9 cents lower at $1.794 and May finished down 6.9 cents also to $1.868.
Analysts saw declining supply throughout 2016 and hinted at a rebalanced market with stout season-ending inventories.
“Our 21-basin gas supply model shows U.S. dry production down by 5.2% in 2016. Appalachia is the only region in which our model shows growth, with today supply up by about 900 MMcf/d in 2016,” said Jefferies analyst Jonathan Wolff in a report. “Supply gains in this basin are offset by declines across all additional basins that we track, with the largest declines coming from the Eagle Ford (-900 MMcf/d), Anadarko Basin (-650 MMcf/d), and Barnett, Fayetteville, and East Texas (all falling by about 500 MMcf/d).
“We model total supply decline of 6.2%, with increased exports to Mexico and a decrease in net imports from Canada. We model supply down by 1.7 Bcf/d during the summer ‘refill season.'”
Jefferies doesn’t make any specific price predictions but said “longer-dated strips are holding up. Despite squishy cash markets (April trading at about $1.85/MMBtu), 2017+ ($2.73/MMBtu) have held up well due to reduced industry capex and slowing growth trends. The better tone to gas has surfaced in recent private market transactions that seem to confirm long-term value in gas.”
LNG exports continued unabated as well. Industry consultant Genscape Energy reported that the LNG vessel Clean Ocean left the Sabine Pass facility March 15 carrying 3.31 Bcf. Liquefaction at Train 1 appears to be ongoing as delivery nominations continue to Sabine. Another vessel, Energy Atlantic was awaiting in the Gulf of Mexico.
© 2024 Natural Gas Intelligence. All rights reserved.
ISSN © 2577-9877 | ISSN © 1532-1258 |