E&P | NGI All News Access | NGI The Weekly Gas Market Report
Upstream Drilling, Production Costs Drop 25-30% in 2015 From 2012, EIA Says
Prices, costs and new well productivity in the U.S. onshore and Gulf of Mexico changed significantly over the past decade as operators improved their techniques, efficiencies that likely will get better in the years ahead, according to a study prepared for the Energy Information Administration.
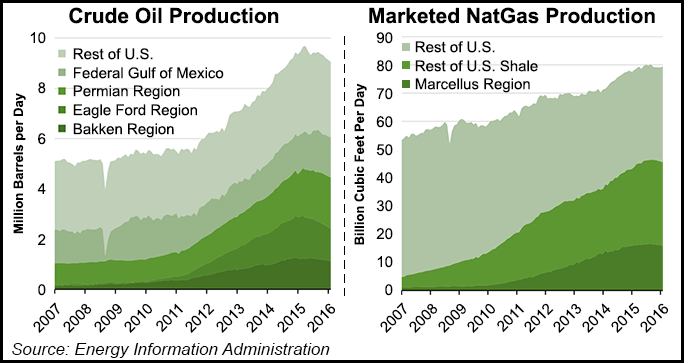
IHS Global Inc. was commissioned to analyze upstream drilling and production costs for several key basins from 2006 through 2015. The report, issued Wednesday by EIA, reviews capital and operating costs associated with drilling, completing and operating wells for the U.S. offshore, as well as the Bakken, Eagle Ford and Marcellus shales and the Permian Basin’s Midland and Delaware formations.
Overall, IHS researchers found that average well drilling/completion costs fell in 2015 by 25-30% from 2012 — when costs/well were at their highest point in a decade.
“Total capital costs per well in the onshore regions considered in the study from $4.9 million to $8.3 million, including average completion costs that generally fell in the range of $2.9 million to $5.6 million per well,” researchers said. “However, there is considerable cost variability between individual wells.”
Since 2006, costs have shifted dramatically. As the oilfield services (OFS) industry was ramping up capacity from 2006 to 2012, drilling and completion costs rose. Since the, however, reduced activity because of falling prices, along with improved drilling efficiency and tools, have cut into overall expenses.
Since 2015, changes in cost rates and well parameters also affected plays differently, “with recent savings ranging from 7-22% relative to 2014 costs.”
Five key cost categories, which account for about 75% of total expenses to drill and complete a U.S. well, were reviewed for the study, including costs for land acquisition, drilling/completion; facilities; lease operations; and gathering/processing/transport.
Bakken wells were found to be the highest priced of the onshore basins because operators have opted to drill longer well lengths and use premium-priced resin-coated proppants (RCP). Marcellus wells were the least expensive because the drilled wells are shallower, and operators tend to use cheaper sand versus RCP as the proppant of choice.
Big differences also were found for costs in the types of wells being drilled. Both vertical and horizontal depths have dropped over time, driving some of the efficiency improvements characteristic of domestic production over the past decade.
“Recent declines are are partly a result of an oversupply of rigs and service providers,” IHS said. “Standardization of drilling and completion techniques will continue to push costs down.”
IHS is forecasting a continued downward trajectory in costs in onshore wells as drilling activity declines. Rig rates are expected to fall by 5-10% this year, then inch about 5%/year higher in 2017 and 2018. Additional efficiencies also are expected in drilling rates, lateral lengths, proppant use, multi-well pads and the number of fracture stages, which could drive down boe costs.
In the GOM, there are fewer than 100 deepwater wells, but each offshore project — unlike unconventional wells that tend to be similar in the same play or basin — has a unique design and cost profile, IHS said. Wells are expensive and high risk, often taking years to design and develop, which means they are less sensitive to price fluctuations.
“Nevertheless, recent low commodity prices do appear to have reduced some Gulf of Mexico offshore drilling,” researchers said. IHS modeled a 15% reduction in deepwater costs in 2015, mostly because of a drop in rig rates. However, researchers expect to see 3%/year cost growth from 2016-2020.
EIA plans to use the IHS observations as a guide to “potential changes in near-term costs” as exploration and production (E&P) companies deal with the challenging price environment. The overall trends in well development costs generally are less transparent than price and productivity trends, regulators said.
“Given the role of present and future cost trends to determining future trajectories of U.S. oil and natural gas production under a range of possible future price scenarios, it is clearly important to develop a deeper understanding of cost drivers and trends,” EIA said.
While E&Ps onshore and offshore have touted sharply declining costs to drill wells, reduced expenses can be attributed in part to renegotiated contracts with suppliers since oil prices crashed.
The world’s largest OFS operator, Schlumberger Ltd., doesn’t subscribe to the theory that E&P efficiencies are as good as some companies claim. CEO Paal Kibsgaard at the Scotia Howard Weil 2016 Energy Conference in New Orleans last Monday said drilling has gotten better, but OFS operators are fighting for survival and are doing what it takes to keep customers — cutting prices as much as they can and even taking losses (see Shale Daily, March 21). Once activity begins to pick up, OFS pricing mostly will reverse, Kibsgaard said.
However, Rystad Energy analysts also determined that the onshore wellhead breakeven price in the last three years has fallen sharply — ahead of the decline in commodity prices. Rystad reviewed U.S. onshore costs between 2013 and 2015; the commodity price slump didn’t occur until the last half of 2014.
Depressed prices have cut into U.S. unconventional production, but “shale wells have become more efficient every year,” said Rystad Senior Analyst Bielenis Villanueva Triana.
“On average, the wellhead breakeven price has dropped by more than 40% between 2013 and 2015.” Among the onshore basins, Rystad found that the Permian’s Midland and Delaware formations exhibited the largest decline in breakeven prices.
© 2024 Natural Gas Intelligence. All rights reserved.
ISSN © 2577-9877 | ISSN © 1532-1266 | ISSN © 2158-8023 |