Marcellus Natural Gas Prepares For Exit; Midwest Pricing May Get Trampled
With a flood of Marcellus natural gas lining up at the exit there’s a good chance Midwest pricing may get trampled as the gas races to previously inaccessible markets. Tallgrass Energy Partners LP’s REX Zone 3 promises to be the new way out with the anticipated Aug. 1 beginning of East-to-West flows on the pipeline, which has major interconnects with Midwest-serving pipelines such as ANR, PEPL, and NGPL.
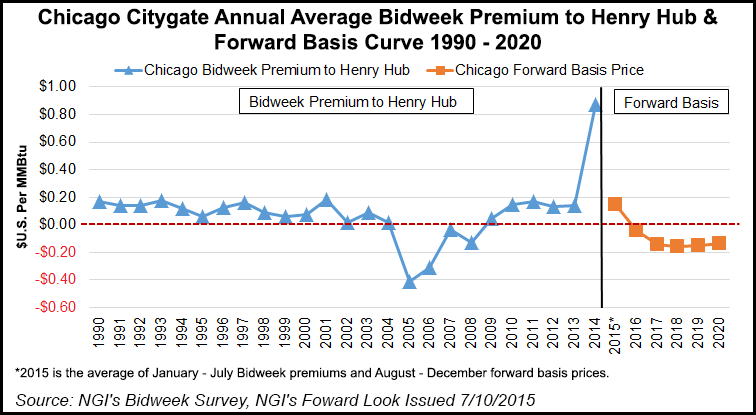
The news has market participants considering what will become the new reality for major Midwest demand centers. Chief among these points is the Chicago Citygate, which has generally maintained a premium to Henry Hub pricing. This, it seems, will no longer be the case, according to analysis of NGI‘s Forward Look data.
“Looking to the forward markets, one finds August Chicago basis pricing at a slight discount to the hub of 0.8 cents,” said Nathan Harrison, NGI markets analyst. “Going out to September and October this negative basis widens to negative 2.5 cents. Looking farther down the curve things get even more interesting.”
Averaging the Chicago basis prices for all months in 2016 produces a discount of 4 cents to the Hub, which becomes a discount of 14 cents in 2017, and 16 cents in 2018, according to NGI‘s Forward Look.
“This implies a new paradigm under which Midwest markets like Chicago trade below the Hub,” Harrison added.
On the horizon, natural gas price bulls don’t have a whole lot to write home about, according to analysts and price forecasts. Domestic oil and natural gas production are proving resilient despite the drop in rigs, which quashes much hope for higher commodity prices this year, according to analysts.
Jefferies LLC, BMO Capital Markets and Topeka Capital Markets (TCM) analysts all recently reviewed the status of onshore gas and oil plays, and each offered less than promising price forecasts through the rest of 2015 for either commodity (see Shale Daily, July 7a). Their forecasts mirror in part an analysis by Barclays Capital late last month, which predicted only a brief bull run for gas this summer (see Daily GPI, June 29).
Jefferies equity analyst Jonathan D. Wolff and his team said domestic gas output appears to have peaked after falling for two consecutive months. In addition, they see limited growth over the near term because of continuing infrastructure constraints in the Northeast and reduced associated gas production.
However, the long-term New York Mercantile Exchange outlook was cut 25 cents to $4.00/MMBtu because “more resilient” gas production than expected and a more conservative outlook for liquefied natural gas exports, Wolff said. Slowing Northeast supplies would be a “major bullish factor” over the long-term.
However, at least the overarching bearishness on natural gas prices appears to has been tamed somewhat. Natural gas price forecasts, which had tumbled for months, may finally be firming, with the Energy Information Administration (EIA) expecting Henry Hub prices to average $2.97/MMBtu this year and $3.31/MMBtu in 2016 (see Shale Daily, July 7b).
The 2015 price forecast, released during the first week of July in EIA’s latest Short-Term Energy Outlook (STEO), is unchanged from the previous STEO, and the 2016 price forecast is just a penny lower than last month (see Shale Daily, June 9).
Looking more near-term, the natural gas storage situation remains bearish. On Thursday futures bears were treated to an outsized storage report well above expectations, but price results were counterintuitive. The EIA in its Thursday morning storage report said inventories increased by 91 Bcf for the week ended July 3, greater than what the market expected by about 5 Bcf. Prices initially eased, but at the closing bell Thursday, August had gained 4.1 cents to $2.726 and September was higher by 4.1 cents as well to $2.738 (see Daily GPI, July 9).
Prior to the release of the data, analysts were looking for an increase in the mid-80 Bcf range. Bentek Energy’s flow model calculated a build of 88 Bcf, and IAF Advisors was counting on a 84 Bcf increase. A Reuters poll of 23 traders and analysts showed an average 86 Bcf with a range of a 79 Bcf to a 93 Bcf injection.
Traders were unimpressed with the move lower. “There’s not a lot of conviction in the market’s move. It’s just drifting within its [established] trading range,” said a New York floor trader.
When queried whether Thursday’s apparent lack of downside follow-through to an otherwise bearish number offered a buying opportunity, the trader said, “I think a little lower from here. The upper $2.50s to lower $2.60s. The problem is there is nothing fundamental on the horizon to change people’s opinions.”
Tim Evans of Citi Futures Perspective saw the “91 Bcf build for last week as above the consensus estimate and also more than the 76 Bcf five-year average refill, and so moderately bearish in terms of its immediate price impact. This will be a test for the market, but we still expect prices to hold above the June and April lows, which may set up an eventual intermediate-term price recovery.”
Inventories now stand at 2,668 Bcf and are 658 Bcf greater than last year and 45 Bcf more than the five-year average. In the East Region 69 Bcf was injected, and the West Region saw inventories decline by 1 Bcf. Stocks in the Producing Region rose by 23 Bcf.
Longer-term analysis suggests, however, that demand will have to increase substantially to rebalance the market. In a Thursday morning report RBN Energy said, “With about 127 days between June 26 and the end of the theoretical injection season on Oct. 31, gas demand would need to continue exceeding 2014 demand by 5 Bcf/d or more for the entire period to drop inventories back down to last year’s level.
“But while the hottest months are still ahead, air conditioning use is likely to decline during the fall ‘shoulder’ months. That could bloat storage injections again and leave a surplus going into the gas winter season at the end of October, especially if there are no further production slowdowns.”
Despite recent weakness, long-term market technicians are undeterred in their longer-term bullish outlook. Analysts at United ICAP cite numerous wave count and retracement support levels. “Given the widespread support, our strategy remains unchanged, we prefer to be scale-down buyers (in Q4 2015 and Q1 2016 only) with a protective sell stop beneath $2.406,” said Brian LaRose, a market technician with the firm.
© 2024 Natural Gas Intelligence. All rights reserved.
ISSN © 2577-9915 | ISSN © 2577-9877 |