Fifteen Years Later, NGI’s Quarterly NatGas Marketers Survey Tells a Different Story
The total amount of natural gas sold by participants in NGI‘s quarterly marketers ranking survey increased only marginally in the first quarter of the year compared with 1Q2014, but the underlying markets are hardly stagnant.
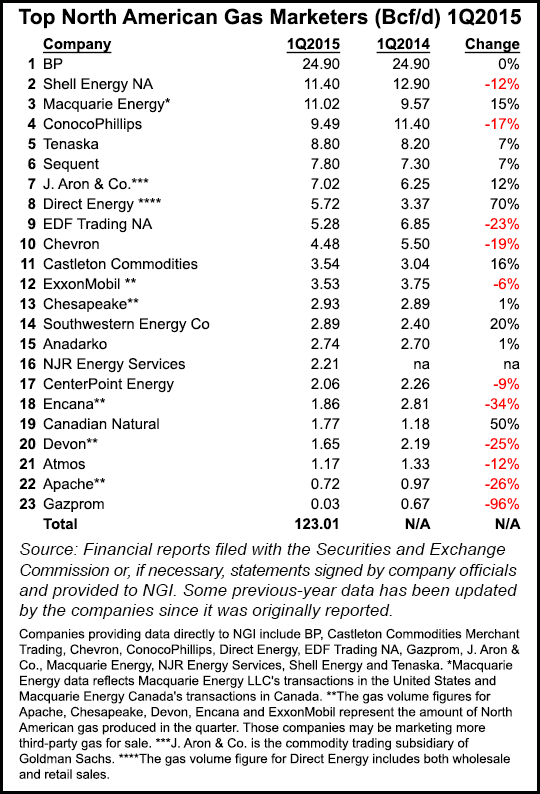
Twenty-two leading gas marketers reported combined sales transactions of 120.77 Bcf/d in NGI‘s 1Q2015 Top North American Gas Marketers Ranking, a 1% decline compared with the 121.76 Bcf/d those same companies reported in 1Q2014.
Despite the fact that production is much greater today, that’s a lot less marketed gas than the 180.5 Bcf/d that NGI reported in its first quarterly survey in 1Q2001, when Enron led the list of marketers. That era of high-volume trading has been swept away, along with Enron and a number of other middlemen.
Today the perennial survey leader BP plc reported 24.90 Bcf/d, unchanged compared with 1Q2014, while four of the survey’s top 10 and a dozen companies overall reported lower numbers in 1Q2015 than in the year-ago period (see Daily GPI, June 12, 2014).
Shell Energy NA reported 11.400 Bcf/d in 1Q2015, a 12% decline compared with 12.90 Bcf/d in 1Q2014. Parent Royal Dutch Shell plc recently gained the approval of U.S. regulators for its proposed buyout of UK rival BG Group plc, a $70 billion transaction that is expected to enhance Shell’s gas business, allowing it to become the global leader in liquefied natural gas exports (see Daily GPI, June 17; April 8). The merger is expected to be completed early next year.
The largest decline for the eighth consecutive month came at ConocoPhillips, which reported 9.49 Bcf/d, down 1.91 Bcf/d (17%) from 101.40 Bcf/d in 1Q2014. Such double-digit declines, which ConocoPhillips first reported in NGI‘s 1Q2013 survey, are primarily because of the implementation of business model restructuring in North America following the spin-off of downstream operations in 2012 (see Daily GPI, April 17, 2012) and the company’s view of market conditions. ConocoPhillips recently slashed $2 billion from its capital expenditures budget for 2015 — from $13.5 billion to $11.5 billion — citing the collapse in world crude oil prices.
Other decreases compared with 1Q2014 were reported by EDF Trading (5.28 Bcf/d, down 23%), Chevron Corp. (4.48 Bcf/d, down 19%), ExxonMobil Corp. (3.53 Bcf/d, down 6%), CenterPoint Energy. (2.06 Bcf/d, down 9%), Encana Corp. (1.86 Bcf/d, down 34%) and Devon Energy Corp. (1.65 Bcf/d, down 25%).
But there were notable upturns compared with the year ago period, too. Macquarie Energy reported 11.02 Bcf/d in 1Q2015, a 15% increase compared with 9.57 Bcf/d in 1Q2014. Other companies reporting increases included Tenaska (8.80 Bcf/d, up 7%), Sequent Energy Management LP (7.80 Bcf/d, up 7%), J. Aron & Co. (7.02 Bcf/d, up 12%), Castleton Commodities (3.54 Bcf/d, up 16%), Chesapeake Energy Corp. (2.93 Bcf/d, up 1%) and Southwestern Energy Co. (2.89 Bcf/d, up 20%).
Direct Energy moved into the Top 10 with 5.72 Bcf/d, a 70% increase compared with 1Q2014, thanks in large part to the inclusion for the first time of both its wholesale and retail sales. Direct Energy, which acquired Hess Corp.’s energy marketing business two years ago (see Daily GPI, July 31, 2013), reported 3.37 Bcf/d in its first appearance in the NGI survey in 1Q2014.
The relative calm at the top of the rankings isn’t a sign that natural gas markets are in the doldrums, Maryland-based energy consultant Ben Schlesinger told NGI.
“I think there’s a great deal happening. We’re seeing new markets develop, and the flow changes are incredible, everybody understands that, with 19 Bcf/d coming out of the Marcellus and Utica. Will it go to 20 Bcf/d? The answer, of course, is that it will. The only question is when?
“Gas marketers are the front line of this industry. I think the two major markets are exports and industry, followed by some new power plant possibilities. The export business is really beginning to pick up. We’re seeing the initial deals take place…there is a lot of interesting pickup that’s beginning to gather steam on the demand side of the business. That will, of course, hopefully drag some of the price problems that the industry is experiencing out of the doldrums.”
It’s all a far cry from NGI’s first quarterly ranking of marketers in 1Q2001 (NGI had published annual marketer results beginning in 1996), when the field was dominated by Enron Corp. and reported a 20-company total of 180.5 Bcf/d (see Daily GPI, June 4, 2001). Newcomers to the industry may be stumped by the companies heading that 1Q2001 list of top marketers, which included Enron, El Paso, Duke, Mirant, BPAmoco, Reliant, Sempra, Dynegy, Aquila and Coral. Enron would still be ranked No. 1 in the rankings today with the 26.7 Bcf/d it reported 15 years ago.
Since then, marketers have weathered Enron’s notorious collapse, the Great Recession and the tsunami of supply — and tumbling prices — brought on by the North American Shale Gale. Enron’s final appearance in the survey came before it declared bankruptcy in 3Q2001. BP took over the top spot in 1Q2003 and has been firmly entrenched there ever since.
“The rise in unconventional production has been led by independents, many of whom were not on the radar more than a decade ago,” said Patrick Rau, NGI‘s Director of Strategy & Research. “Not too many were fully aware of companies such as Range Resources, Chesapeake Energy, and Southwestern Energy back then. At the turn of the century, how many people fully understood what horizontal drilling and hydraulic fracturing were?
“In 2001, the Barnett Shale, the granddaddy shale play in the U.S., was still very much in its early innings. By the middle of the 2000s, there were dozens of proposed U.S. LNG import facilities, out of fear that falling U.S. production wouldn’t keep pace with domestic demand. Given that perceived scarcity in supply, it makes sense that gas might have changed hands several times before finding a home, which also likely contributed to some of the lofty marketed volumes in the early 2000s.”
Changes in the regulatory climate likely also have contributed to the decline in marketed volumes over the last 15 years. “All anyone has to do is watch a rerun of the ‘Smartest Guys in the Room’ to get a reminder of what happened at Enron, and the subsequent fear that caused in the industry,” Rau said. But he also believes that a more recent trend in governmental scrutiny over trading practices, as noted by Dodd-Frank and actions taken by the Commodity Futures Trading Commission, have contributed to the decline in marketed volumes as well. “Several prominent financial houses have left the physical commodities markets over the last few years, and some of those had a major presence in the U.S. natural gas market,” he said.
NGI‘s survey of North American marketers hasn’t reported an overall increase in sales since 1Q2014, when sales by participating companies increased 0.61 Bcf/d (about 0.5%) compared with 1Q2013. Prior to that, the last increase was recorded in 2Q2012, when participating companies sold a total of 135.86 Bcf/d.
The NGI survey ranks marketers on sales transactions only. The Federal Energy Regulatory Commission (FERC) tallies both purchases and sales. While production was rising, natural gas trading continued to decline last year compared with 2013, according to an analysis by NGI of 2014 Form 552 buyer and seller filings with FERC (see Daily GPI, May 28). Total volumes bought and sold declined for the third consecutive year, reaching 114,603 TBtu, down 3.0% compared with 2013. It was the lowest reported volume total since FERC began publishing Form 552 data six years ago (see Daily GPI, July 6, 2009).
© 2024 Natural Gas Intelligence. All rights reserved.
ISSN © 1532-1231 | ISSN © 2577-9877 | ISSN © 1532-1266 |