U.S. Tops for Global Natural Gas Production, Consumption, Says BP
World natural gas production increased by 1.6% in 2014, four times the growth rate of global consumption (0.4%), with the United States recording the largest production growth at 6.1%, BP plc reported Wednesday.
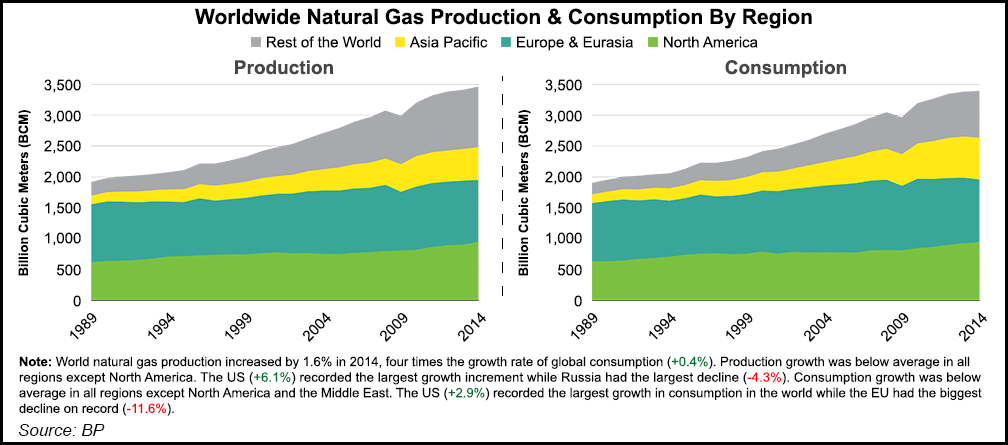
The United States also recorded the largest gas demand growth in the world, according to the 64th annual BP Statistical Review of World Energy.
The estimable review, used by industry and governments for planning, found that global gas output was below average last year everywhere but in North America, with Russia recording the largest decline, down 4.3%.
BP chief economist Spencer Dale discussed the latest findings during a webcast.
Most notable, he said, is the “continuing shale revolution in the U.S. In China, 2014 was the year of the horse. In energy, 2014 was the year of the American eagle, as the U.S. shale industry went from strength to strength.”
U.S. oil growth has been stunning, but so has growth for domestic gas supplies, said Dale.
“U.S. shale gas also continued to grow strongly, with U.S. production accounting for nearly 80% of the total increase in global gas supplies in 2014. Over the past 10 years, U.S. shale gas has accounted for roughly half of the increase in global supplies of natural gas.”
The revised data in this year’s review “suggest that the U.S. overtook Russia in 2013 to be the world’s largest producer of oil and gas. We are truly witnessing a changing of the guard of global energy suppliers. The implications of the shale revolution for the U.S. are profound.”
Last year was a “remarkable year” for energy, boosted by the “continuing revolution in U.S. shale,” Group CEO Bob Dudley said during a webcast with Dale. The “most significant development on the supply side last year was undoubtedly the continuing revolution in U.S. shale.”
Last year the United States replaced Saudi Arabia as the world’s largest oil producer, “a prospect unthinkable a decade ago,” with the country becoming the first ever to increase annual production by at least 1 million b/d for three consecutive years. “The growth in U.S. shale gas in recent years has been just as startling…”
However, the U.S. gains were tempered by energy economics, Dudley said.
“The eerie calm that had characterized energy markets in the few years prior to 2014 came to an abrupt end last year. However, we should not be surprised or alarmed. Indeed, to someone who has worked in the energy business for over 30 years, the volatility and uncertainty that characterized 2014 felt like a return to more normal conditions.”
Still, the tumultuous events shouldn’t be “dismissed as just another bout of cyclical instability,” he said. “Rather, they may well come to be viewed as symptomatic of a broader shifting in some of the tectonic plates that make up the energy landscape, with significant developments in both the supply of energy and its demand. Those developments had profound implications for prices, for the fuel mix and for carbon emissions.”
Specifically for global gas, BP reported:
According to BP, total North American gas production in 2014 reached 948.1 billion cubic meters (bcm), a 5.3% increase from 2013. U.S. gas production jumped to 728.3 bcm from 689.1 bcm, 21.4% of the global total. Canada gas output from 2013 climbed nearly 4% to 162 bcm from 156.1, while Mexico’s declined by 0.2% to 58.1 bcm.
Gas production worldwide increased by 1.6% from 2013 to 3,460.6 bcm, with Organization of Economic Cooperation and Development nations seeing a 3% boost, while developing nations’ output only rose by 0.8%. The Former Soviet Union’s total gas output was down by 2.3%, while EU gas production declined by 9.8%.
Consumption-wise, North American gas demand was 2.5% higher year/year at 949.4 bcm. U.S. gas demand rose by almost 3% to 759.4 bcm, while demand climbed slightly in Canada by 0.3% and in Mexico by 1.4%. Worldwide, gas demand only increased by 0.4% from 2013.
North American gas reserves at the end of 2014 were estimated at 429 Tcf, with the United States holding 345 Tcf, or 5.2% of the globe’s gas. Canada had an estimated 71.7 Tcf, with Mexico at around 12.3 Tcf.
“Growth of global primary energy consumption decelerated markedly in 2014, even though global economic growth was similar to 2013,” Dale noted. “Energy consumption increased by just 0.9% in 2014, a sharp deceleration over 2013 (2.0%) and well below the 10-year average of 2.1%.”
Consumption rose for all fuels, reaching record levels for every type except nuclear power. Production increased in all categories except coal. Notably, while emerging economies continued to dominate growth demand, the increase of 2.4% was well below the 10-year average of 4.2%. Chinese consumption growth of 2.6% was the slowest since 1998.
Again, oil remained the top fuel in the world, with a 32.6% share of consumption but it lost market share for the 15th consecutive year, said Dale. Renewables were the fastest growing form of energy, accounting for a one-third increase in overall primary energy use — even in a year when global consumption slowed. Solar power generation jumped by 38%, while wind energy, up 10.2%, was less than half its 10-year average. Biofuels production was up 7.4%, also below its average. Renewables only accounted for 3% of primary energy sources in 2014.
Meanwhile, global coal consumption only rose by 0.4% from 2013, off the 10-year average growth of 2.9%. Global carbon dioxide emissions from energy use were estimated to be only 0.5% higher year/year, the weakest since 1998 other than the immediate aftermath of the 2008-2009 financial crisis.
© 2024 Natural Gas Intelligence. All rights reserved.
ISSN © 1532-1231 | ISSN © 2577-9877 |