FERC Form 552 Data Details 2014’s Natural Gas Trading Drop
While production was rising, natural gas trading continued to decline last year compared with 2013, and while the number of fixed- and basis-priced deals shrank, index-based transactions grew, according to an analysis by Natural Gas Intelligence (NGI) of 2014 Form 552 buyer and seller filings with FERC.
Total volumes bought and sold declined for the third consecutive year, reaching 114,603 TBtu, down 3.0% compared with 2013. It was the lowest reported volume total since the Federal Energy Regulatory Commission began publishing Form 552 data six years ago (see Daily GPI, July 6, 2009).
Fixed-volume deals continued to fall. In 2010, fixed-volume deals of 27,554 TBtu represented 22.6% of all reported deals, but that was down to 17,931 TBtu and 15.6% of all reported transactions in 2014.
Meanwhile, the amount of gas bought and sold on index continued to rise. A total of 87,578 TBtu of gas, or 76.4% of the annual total, was transacted on index in 2014, compared with 82,521 and 67.8% in 2010. The amount of gas transacted via basis deals also has been trending lower, falling from 9,660 TBtu in 2008 (7.8% of the annual total) to just 6,973 TBtu in 2014 (6.1% of the yearly total).
“There are a couple of reasons that fixed-priced transactions may be giving way to more index deals,” said Patrick Rau, NGI director of strategy and research. “One may be that as natural gas production continues to outpace consumption — and U.S. natgas production has grown at roughly twice the rate of domestic consumption since 2006 — producers have been accounting for more and more of total transacted volumes, and producers tend to sell their gas on index.
“The other reason may be that as price volatility has come down in many parts of the county, buyers may not feel the need or the urgency to lock in fixed-price deals. They may be thinking, ‘why lock in a fixed-price for the longer-term if prices continue to ebb lower?'”
A total of 1,198 entities reported data in 2014, down 1.7% from the 1,219 that reported in 2013, according to the FERC report. And the number of entities who report to indexes, including NGI, also continues to fall. A total of 133 companies said they contributed spot market data to published indices in 2014, down 12.5% from the 152 who reported in 2013, and down 26.5% from 181 in 2009.
The fall in trading volumes at the same time production continues its rapid growth may be ascribed to lower prices and less price volatility, which makes the natural gas market less attractive to speculators and banks which have restricted their trading activities. In 2014 trading volumes were a little over four times U.S. marketed production. In the more halcyon years of the natural gas market some packages of gas were reported to have traded 12 times between the market and burnertip.
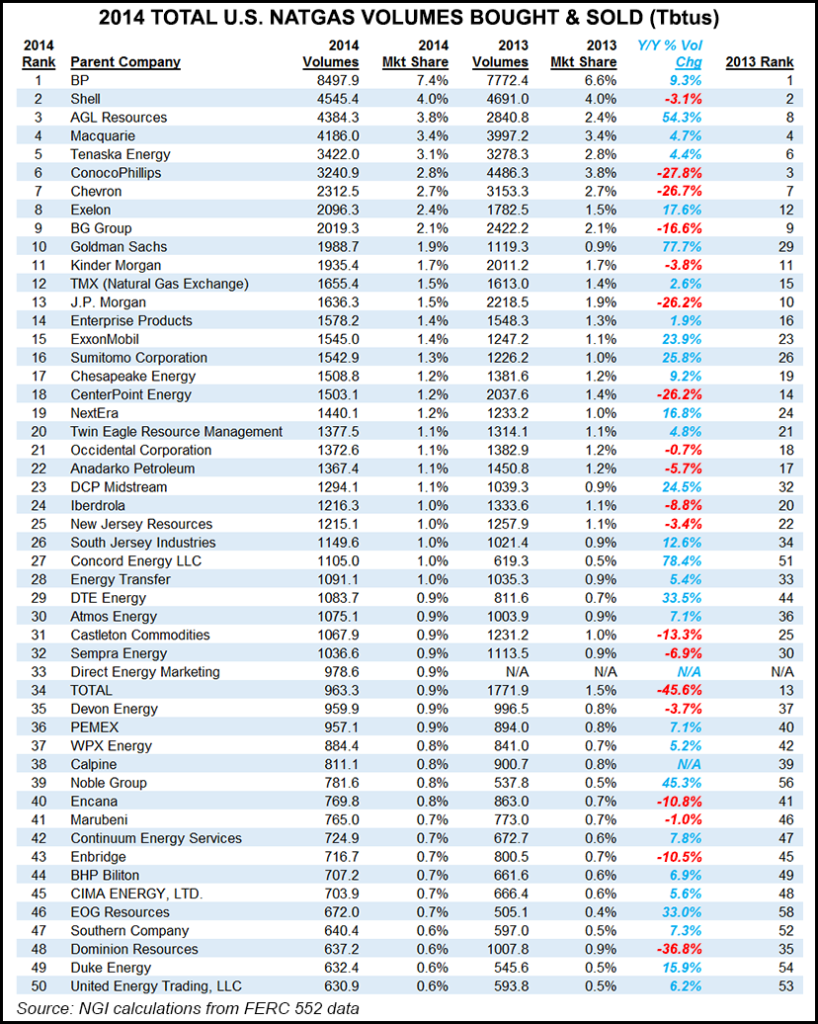
BP plc remained the most active company in 2014 with market share increasing to 7.4% (8,498 TBtu), compared with 6.6% (7,772 TBtu) in 2013. Shell is still No. 2 with 4% of market share, the same as 2013, despite a 3.1% decline in volumes (4,545 TBtu last year, down from 4,691 TBtu in 2013).
AGL Resources made the biggest move in the top 10, leaping to No. 3 with 4,384 TBtu and 3.8% market share, compared with 2,841 TBtu and 2.4% market share in 2013.
Macquarie held steady at No. 4 (4,186 TBtu and 3.4% of market share), followed by Tenaska Energy (3,422 TBtu and 3.1% of market share). ConocoPhillips slipped 3 spots to No. 6 (3,241 TBtu and 2.8% market share), but fellow producer Chevron held steady at No. 7 (2,313 TBtu and 2.7% market share).
Exelon, which had been ranked No. 12 last year, moved up to No. 8 (2,096 TBtu and 2.4% market share). BG Group remained at No. 9 (2019 TBtu and 2.1% market share), and Goldman Sachs surged from No. 29 in 2013 to No. 10 (1,989 TBtu and 1.9% market share), bucking the overall trend of investment banks either falling down or out of the rankings.
Companies moving into the Top 50 included Concord Energy (No. 27, up from No. 51 in 2013); Direct Energy Marketing (No. 33, after acquiring Hess Corp.’s energy marketing business in 2013 (see Daily GPI, July 31, 2013)); Noble Group (No. 39, up from No. 56); EOG Resources (No. 46, up from No. 58); Southern Company (No. 47, up from No. 52); Duke Energy (No. 49, up from No. 54); and United Energy Trading (No. 50, up from No. 53). Among the biggest risers within the Top 50 were Concord Energy, which jumped 24 notches to No. 27, Noble Group, which moved from No. 56 to No. 39, and DTE Energy, which was up 15 spots to No. 29.
EDF Trading, which held the No. 5 spot in 2013 (see Daily GPI, June 5, 2014), completely fell out of the 2014 rankings. Other companies dropping out of the Top 50 were ONEOK (No. 27 in 2013, No. 56 in 2014), Texla Energy Management (No. 28 in 2013, No. 52 in 2014), Hess Corporation (No. 31 in 2013, No. 74 in 2014), Citigroup (No. 38 in 2013, No. 71 in 2014), Gavilon (No. 43 in 2013, n/a in 2014) and QEP Resources (No. 50 in 2013, No. 62 in 2014).
Some of the biggest declines in the Top 50, excluding companies which reported no data in 2014, included Total Energy (down 21 places to No. 34) and Dominion Resources (down 13 places to No. 48).
In its analysis, NGI pooled information so that each company’s total includes data from subsidiaries. This was done to give a more complete picture of parent company activity.
© 2024 Natural Gas Intelligence. All rights reserved.
ISSN © 1532-1231 | ISSN © 2577-9877 | ISSN © 1532-1266 |