NGI Data | NGI All News Access
Bidweek Quotes Tackled For a Loss As Prices Endure Broad Decline
Bidweek prices must have taken a page or two from the petroleum playbook as February quotes slid across the country. Only a handful of points managed gains, and losses of 25 cents to 50 cents were common.
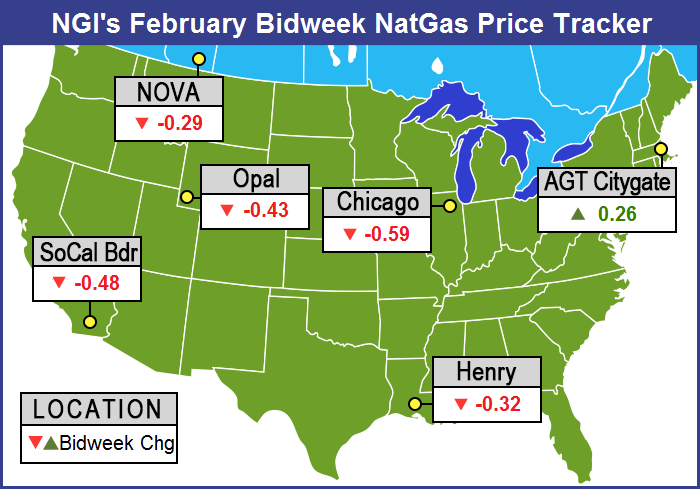
The NGI February National Bidweek Average slipped 32 cents to $3.23. Taken as a whole, the Northeast region suffered the least, dropping only a penny month-to-month to average $4.32. It was the best of times and the worst of times in that region, however, as losses at Tennessee Zone 6 200L (down 77 cents to average $10.29) were offset by gains of $1.16 at Transco Zone 6 New York and 78 cents at Tetco M-3 to average $9.60 and $5.13, respectively.
The West Coast and mid-section of the country took the biggest hits with California dropping 43 cents to $2.87 and the Midwest, Midcontinent, and Rocky Mountains sliding 49 cents, 47 cents, and 46 cents to $3.04, $2.75, and $2.66, respectively.
South Texas bid week average came in 35 cents lower at $2.76, and South Louisiana was off 32 cents to $2.83.
East Texas fell 29 cents to $2.78, but the Northeast dropped only a penny to $4.32.
February futures settled at $2.866, down sharply from January’s settlement at $3.189.
The tone of bidweek was largely reflected in Thursday’s Energy Information Administration (EIA) Storage report as the bearish figure raised as many questions as it answered, and the actual figure came in well under expectations. The EIA announced a withdrawal from storage of just 94 Bcf, about 20 Bcf less than market expectations, and prices fell hard. At the close, the newly minted spot March futures took a 12.3-cent drubbing to finish at $2.719 and April was lower by 11.5 cents to $2.715.
With nine weeks remaining on the traditional withdrawal season, slightly less than 100 Bcf would have to be pulled weekly to bring supplies under the arguably bearish ending inventory level of 1,700 Bcf.
All indications were that the figures for the week ended Jan. 23 would cause an increased surplus relative to a year ago and diminish the year-on-five-year deficit. Last year a stout 219 Bcf was withdrawn and the five-year pace stands at 168 Bcf. IAF Advisors calculated a pull of 108 Bcf and ICAP Energy was looking for a withdrawal of 114 Bcf. A Reuters poll of 21 industry traders and analysts resulted in a sample mean of a 113 Bcf draw with a range of 97 Bcf to 144 Bcf.
The best minds in the business missed the mark as the number came in far less than what traders were anticipating. March futures fell to a low of $2.691 after the EIA number was released at 10:30 a.m. EST and by 10:45 March was trading at $2.703, down 13.9 cents from Wednesday’s settlement.
“We were trading unchanged just before the number came out, and this thing fell out of bed once the number was released,” said a New York floor trader.
“A close above $2.75 might convert to a support level.”
Tim Evans of Citi Futures Perspective said “The 94 Bcf net withdrawal was well below the 110-113 Bcf consensus expectations, with the shortfall suggesting a weakening of the underlying supply/demand balance, with bearish implications for future reports.”
Inventories now stand at 2,543 Bcf and are 324 Bcf greater than last year and 79 Bcf below the 5-year average. In the East Region 69 Bcf were withdrawn and the West Region saw inventories fall 9 Bcf. Stocks in the Producing Region declined by 16 Bcf.
Bidweek traders took the report in stride and the question of whether the weak report might lead some index buyers to commit less volumes because of a bearish price scenario has not fully played out. “I don’t know whether one storage report makes the difference in where we are relative to the five-year average and that kind of thing,” remarked an industry pipeline veteran.
“You kind of wonder who dropped the ball on that [report].Was it a mis-report by a pipeline, did someone not get their numbers in on time. That’s a big number to be off that much. It’s not like it was 400 Bcf or something like that. It would seem that would not be a hard number to zero in on.
“I don’t think that changes the belief that we are going to have plenty of gas going into February. I don’t think that changes anyone’s rationale for making index purchases. What does that [report] say to the market. Is there a reason to keep prices where they are now or do we just keep pushing them down? People may have decided to draw down on backup systems like LNG and propane, and maybe last week was more of a time to do that. This week should show a bigger withdrawal number,” the veteran said.
Plenty of gas seemed to be the operative concept for bidweek marketing. “We locked in out basis way back in the fall which was a lot higher than it is now,” said a Michigan trader. “The good news is that Nymex is low, but its our understanding that many people locked up ahead of the winter, now there is no place for the gas to go.
“Everybody is full. We are full and with what we did we pretty much had already bought for February. We won’t be buying much spot gas for February,” the marketer said.
Futures prices continued their trek lower Friday as traders digested government reports showing production as much as 7 Bcf/d higher than a year ago. At the close, March had eased 2.8 cents to $2.691, and April was off 2.8 cents as well to $2.687.
Weather forecasts continued a trend of moderation overnight Thursday. Friday’s six-10 day forecast “is not as cold or warmer than the previous forecast across much of the nation,” said WSI Corp. “This is due to model trends and the day shift. Forecast confidence has improved and is average as models are in rather good agreement with the evolution of the large scale pattern.
“There is a slight cold risk across the central and southern U.S., mainly early in the period. Otherwise, the much of the West and Plains have a slight upside risk due to an amplified pattern.”
© 2024 Natural Gas Intelligence. All rights reserved.
ISSN © 1532-1258 | ISSN © 2577-9877 |