E&P | NGI All News Access | NGI The Weekly Gas Market Report
Another Record Month in December Pushes 2015 U.S. Dry Gas Production Above 27 Tcf
Collapsed market prices weren’t enough to hold down natural gas production in the United States in 2015, with another record high recorded in the final month of the year, according to the Energy Information Administration (EIA).
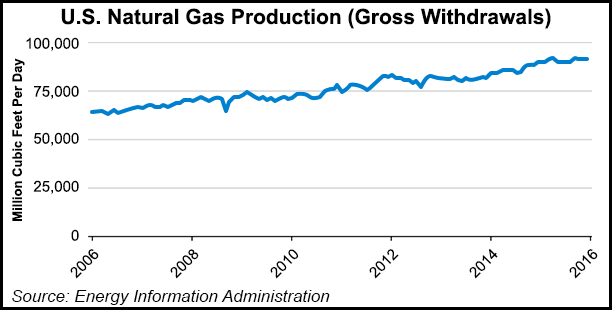
Dry gas production in December reached 2.29 Tcf (73.8 Bcf/d), the highest of any December since EIA began reporting such production data in 1973, according to EIA’s latest Natural Gas Monthly report. EIA-reported monthly production totals from earlier in 2015 also reached record highs (see Daily GPI, Feb. 2), elevating the 2015 dry gas production total to 27.09 Tcf. That total was up 5.3% compared with 25.73 Tcf in all of 2014.
Total U.S. natural gas production was 2.82 Tcf in December, compared with 2.77 Tcf in December 2014. Alaska reported 304.05 Bcf (up from 301.64 Bcf in December 2014); Louisiana, 163.80 (up from 158.52 Bcf); Oklahoma, 206.49 Bcf (up from 201.69 Bcf); New Mexico, 102.25 Bcf (down from 108.67 Bcf); Texas, 720.59 Bcf (down from 762.60 Bcf); Wyoming, 165.66 Bcf (down from 169.11 Bcf); and Federal Offshore Gulf of Mexico, 109.29 Bcf (up from 107.02 Bcf).
EIA last summer for the first time included in the monthly natural gas production survey state-level data from 10 states, including some shale-rich names previously grouped into its “other states” category (see Daily GPI, June 30, 2015). Production in those 10 states in December was led once again by Pennsylvania, home of the mighty Marcellus Shale, which reported 429.25 Bcf, up a staggering 15.7% compared with 371.08 Bcf in December 2014. Also formerly grouped in the Other States category were Arkansas (80.49 Bcf), California (18.87 Bcf), Colorado (141.95 Bcf), Kansas (22.74 Bcf), Montana (4.68 Bcf), North Dakota (51.07 Bcf), Ohio (113.10 Bcf), Utah (34.20 Bcf) and West Virginia (105.95 Bcf). The diminished Other States category reported 48.29 Bcf.
At the same time, domestic crude oil production fell in December. U.S. crude production was 9.26 million b/d, down 1.8% compared with 9.43 million b/d in December 2014, according to EIA. Declines were widespread, led by the nation’s two largest crude-producing states: Texas (3.34 million b/d, down 4.9% compared with 3.41 million b/d in December 2014) and North Dakota (1.14 million b/d, down 7.0% compared with 1.23 million b/d in December 2014).
One of the few areas seeing increased crude production was the Federal Offshore Gulf of Mexico, with an estimated 1.63 million b/d, up 12.4% compared with 1.45 million b/d a year earlier.
Consumption of dry natural gas, which also hit record marks at times in 2015, in December was 2.60 Tcf (83.8 Bcf/d), a 3.3% decrease from 2.69 Tcf (86.71 Bcf/d) in December 2014. For all of 2015, consumption was 27.47 Tcf, compared with 26.70 Tcf in 2014 and 26.16 Tcf in 2013. Electric power deliveries in December were 771 Bcf (24.9 Bcf/d), a 21.2% increase from 20.5 Bcf/d in December 2014. Industrial deliveries were 669 Bcf (21.6 Bcf/d), a 2.8% decrease from December 2014. In a continuation of a lengthy downward trend, deliveries to residential consumers were 589 Bcf, (19.0 Bcf/d), down 17.9% from December 2014, and commercial deliveries were 351 Bcf, (11.3 Bcf/d), a 17.8% decrease from December 2014.
Net imports of natural gas were 66 Bcf for December, compared with 117 Bcf a year ago. Total net imports in 2015 reached 949 Bcf, compared with 1.18 Tcf in 2014 and 1.31 Tcf in 2013.
© 2024 Natural Gas Intelligence. All rights reserved.
ISSN © 1532-1231 | ISSN © 2577-9877 | ISSN © 1532-1266 |