Markets | NGI All News Access | NGI The Weekly Gas Market Report
Raymond James Turns Bearish on U.S. NatGas for 2018 and Beyond
Analysts with Raymond James & Associates Inc. have turned negative on U.S. natural gas prices beyond 2017, as faster-than-anticipated growth in supply, along with surprising gains in renewable power generation capacity, are expected to displace more demand than forecast only four months ago.

In early January analysts had said U.S. gas prices were poised for the best prices in 2017 since 2014. While they are are maintaining a 2017 forecast of $3.25/Bcf, the 2018 estimate has been slashed to $2.75 from $3.50 and the long-term forecast reduced to $2.75 from $3.00.
“All told, we now expect the 2018 U.S. gas market to be 1.1 Bcf/d looser (more bearish) than our previous outlook,” said analysts led by J. Marshall Adkins, John Freeman and Pavel Molchanov.
Wells Fargo Securities LLC last month raised its 2017 price outlook to $3.38/MMBtu but reduced its outlook for 2018 and beyond to $3.25. BofA Merrill Lynch Global Research last month kept unchanged its 2017 average from April through December at $3.50/MMBtu, while Barclays reduced its 2017 forecast to $3.02 from $3.38. The Energy Information Administration (EIA) in March reduced the 2017 spot price to $3.03/MMBtu, 12% lower than its February outlook.
The Raymond James team in a note Monday explained how burgeoning domestic gas supply growth beginning in the back half of 2017 and into 2018, coupled with the outlook for demand drivers and the rise of renewables, will impact Henry Hub price forecasts — and not in a good way.
“We anticipate that respectable demand growth will simply be overwhelmed by a massive U.S. natural gas supply surge of 5 Bcf/d-plus” on increased pipeline takeaway from the Marcellus/Utica, growth in oil-driven associated gas supply mostly from the Permian and a modest recovery from the resurgent Haynesville Shale, analysts said.
Associated gas from onshore oil wells also is set to accelerate and pressure gas pricing. In addition, renewables increasingly are cost competitive with gas.
Mexican exports are lower and Canadian imports are higher this year, but the surge in renewable power “is likely to crush gas demand growth,” Adkins said. The three variables make the 2018 gas model almost 2 Bcf/d more bearish than originally forecast.
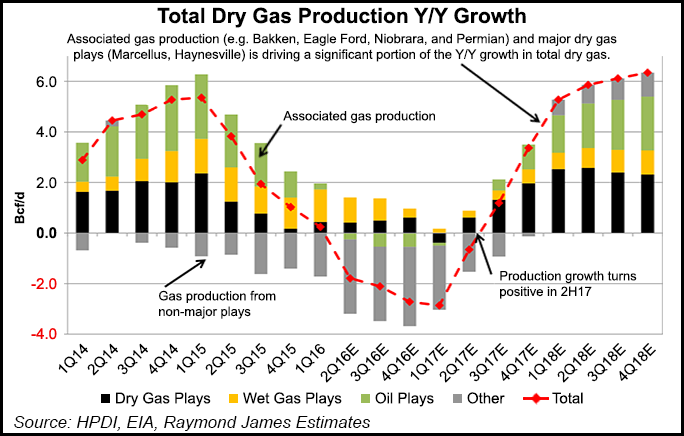
By the second half of 2017, U.S. gas supply should begin to accelerate. Compared with the Raymond James forecast early this year, U.S. dry gas production growth now is expected to be about 900 MMcf/d higher in 2017 year/year (y/y), based on revisions by the EIA.
U.S. onshore gas production, which had been on a downward trend for more than a year, returned to the upside in January and was set to continuing moving higher into April, according to EIA.
Output from Raymond James’ modeled dry gas plays, the Marcellus, Haynesville, Fayetteville and Barnett shales, along with the wet gas Utica and Midcontinent, should remain muted for the first half of the year, with slight y/y declines from associated gas in the Eagle Ford and Bakken shales, Niobrara formation and Permian Basin — until the second half of this year.
Beyond June, look for gas growth to pick up the pace, first in dry gas, followed by associated gas from oil wells.
The mighty Marcellus will carry the day in growth, up overall y/y at 1 Bcf/d “in anticipation of a plethora of midstream capacity planned for 2018,” followed by the Haynesville Shale rising by 0.2 Bcf/d.
“Taken together, dry gas production should be up 2 Bcf/d y/y by the end of 2017,” Raymond James analysts said.
Associated gas growth should be roughly flat y/y because of minor declines in 1Q2017, but expect growth on that end into the second half of this year too, rising 1 Bcf/d y/y.
Raymond James anticipates declines in other gas plays mostly to subside by year’s end, with growth relatively flat entering 2018.
Next year expect to see a massive 5 Bcf/d-plus in growth, led by the Marcellus, Utica, Haynesville and associated gas.
“Looking to 2018, we anticipate a pronounced recovery in dry gas production, particularly as a result of increased volumes from the Marcellus/Utica, a continued resurgence in the Haynesville, and growing associated gas production from increased activity in major oil plays (e.g., Permian, Eagle Ford, Niobrara),” Adkins said.
Planned pipeline capacity expansions underway should lead to meaningful growth from the Marcellus and Utica in 2018. In addition, threshold breakevens in the Marcellus and some areas of the Utica have fallen below $2.00/MMBtu, which has incentivized increased drilling and completion activity, as takeaway is accessible.
In the Marcellus alone, Raymond James model indicates 2.2 Bcf/d of y/y (November-November) growth in 2018, contributing 42% of overall dry gas growth for the year. About 6.5 Bcf/d of planned unrisked 2018 gas pipeline takeaway capacity also is expected to come online in Appalachia, further accelerating growth.
In addition, analysts advised to not underestimate the Haynesville’s gas supply contribution. A resurgence in the North Louisiana/East Texas play should drive “respectable” y/y dry gas volumes in 2018.
“The rig count bottomed at 12 rigs in April 2016, but in 2018, we anticipate the rig count to average 42 rigs, up 3.5x times from the trough,” Adkins said. Enhanced completions, mostly because of increased proppant loads, have led to a revival in single well economics.
“In 2018, we anticipate dry gas volumes in the Haynesville to increase 0.5 Bcf/d y/y to 6.3 Bcf/d,” analysts said.
Meanwhile, associated gas growth from oily basins should be the final straw, with more than 1.5 Bcf/d of growth in 2018 y/y, with nearly all of it (1 Bcf/d) from the Permian.
As the Eagle Ford also begins to awaken, dry gas output should be up 0.5 Bcf/d y/y in 2018, making up a “sizable” share of associated growth.
© 2024 Natural Gas Intelligence. All rights reserved.
ISSN © 1532-1231 | ISSN © 2577-9877 | ISSN © 1532-1266 |
