NGI Archives | NGI All News Access
North America’s Sand Market Continues Boom Times, Says Raymond James
North America’s proppant sand market should see robust growth over the next three to five years, with aggregate consumption hitting 78 million tons per year (mtpy) by 2016, according to new research by Raymond James & Associates Inc.

A collaborative team of analysts came together from across the research platform to complete the 41-page report, “North American Sand Rush: An Underappreciated Pillar of Growth.” Consumption, demand, transportation markets and individual companies are reviewed.
A compound annual growth rate (CAGR) of 22% between 2013 and 2016 is predicted for the North American fracturing (fracking) sand market, underpinned by an upward shift in:
There’s a “near-captive” rail opportunity for Tier 1 sand supply, which is in Wisconsin, Minnesota and Illinois, but there are few practical or economical transportation alternatives available to carry sand to the basins where it needs to be deployed, analysts noted.
In part because of the tight market for Tier 1 sand, analysts expect to see more consolidation/integration of the North American sand supply chain, and the “rising prominence” of long-term contracts. Also expected is a race to develop the other tiers of sand mines that are closer to demand.
As well, analysts are looking for growing momentum behind British Columbia’s liquefied natural gas (LNG) push, which would mean the unconventional gas would be more quickly developed in the province. Also there’s the potential for an increase in fracking activity in Mexico, and the migration from “manifest to unit” train economics.
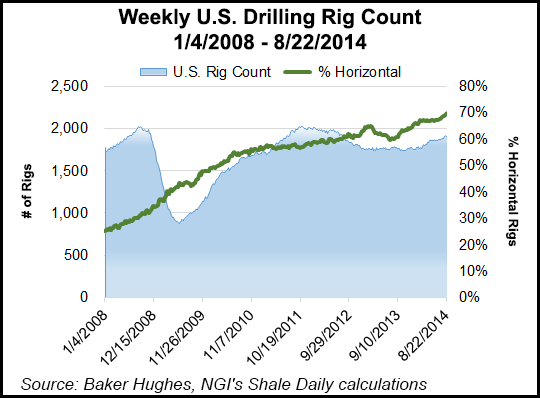
Frack sand often is referred to as one of the most critical ingredients in horizontal well design, and is the “long residual element in place for the life of the well,” analysts noted. Once all of the drilling, pumping and fracking equipment is done, sand is the one key ingredient that remains.
By region, the United States has underpinned the bulk of the growth in the sand market to date, accounting for an estimated 88% of North American demand, or 37 mtpy, while Canada accounted for around 12%, analysts estimate. Some of the data was supplied by PacWest Consulting Partners, which routinely analyzes the North American drilling and completions market (see Shale Daily, May 30).
“Since the start of 2011, U.S. demand has grown at 26%/year and going forward, we expect growth to remain robust at 22%/year, given continued strong fracking activity. Key basins driving this assumption include the Permian, Eagle Ford and Marcellus/Utica.”
In Canada, the frack sand market is in its infancy, but prospective LNG export projects could change that.
“We expect Canadian sand demand to accelerate throughout our 2014-2016 forecast horizon and continue to grow steadily thereafter, given the aggressive development of large-scale gas reserves across Western Canada, many of them in support of the country’s LNG export efforts…
“We expect two of the most important frack sand demand growth basins to be the Duvernay and Montney.” PacWest expects the Duvernay market to grow by 85.2%/year to 1.2 mtpy, and Montney to increase by 32.6%/year and 2.5 mtpy by 2016. “Overall, we expect Canadian frack sand consumption to grow from the current 3.8 mtpy to 6.8 mtpy by 2016, representing a 19.6% CAGR.”
Several independents talked about increasing the use of proppants, including sand, during recent conference calls to discuss 2Q2014 performance.
EP Energy Corp. COO Clay Carrell said the company has begun shorter stage spacing and increased proppant/lateral foot in the Eagle Ford Shale.
“We’re also utilizing more white sand in the conversation now, where we had been exclusively resin-coated sand in the Eagle Ford,” said Carrell. In the Eagle Ford, the company gets “the benefit of lower cost tied to going from resin-coated sand to white sand,” which helps offset higher completion costs overall.
During a conference call to discuss second quarter performance, RSP Permian Inc. COO Zane Arrott’s comments were similar in regards to increasing sand use in the Permian operations.
“When we came into the first quarter, we were spacing our frack stages about 320 feet apart with three first perforated [perf] clusters, and we were using about 1,000 pounds of sand per lateral foot,” Arrott said. “We moved that to 250-foot spacing with four perf clusters. But in the second quarter, we have gone to 225-foot spacing, so we have added more stages, tightened stages…and we’ve moved our sand volume up to 1,400 pounds per lateral foot…
“We’re adding more stages and we’re adding more sand, which of course means a higher cost. But we believe that we are seeing, as well as we are hearing from our peers in the industry, other operators that we’re going to see higher estimated ultimate recoveries doing that.”
It’s the same story for QEP Resources, which is testing completions in the Bakken/Three Forks formations.
“The results of our recent pilot test and those of nearby operators are encouraging for potential down spacing and/or infill drilling in the future,” QEP Chuck Stanley said in early August. “In addition, we’ve recently made a dramatic shift in completion methodology, which we think offers additional upside.
“In the past, we’ve been placing between 3 and 3.5 million pounds of proppant in a typical long lateral Bakken or Three Forks well. But in recent wells, we have placed approximately 10 million pounds of proppant, and we’re doing it through bore entry points or more perf clusters…
“There’s obviously an optimization around increased cost versus increased recovery. But…everything we’re doing now is the larger size.”
© 2024 Natural Gas Intelligence. All rights reserved.
ISSN © 2577-9877 | ISSN © 2158-8023 |
