NGI Archives | NGI All News Access | NGI The Weekly Gas Market Report
U.S. Top NatGas Producer, North America Only Region with Above-Average Consumption, Says BP
North America was the only region in the world with above-average growth in natural gas consumption last year, and the United States remained the world’s leading gas producer, albeit at a slower pace, BP plc reported Monday in its highly anticipated annual energy economic review.
The Statistical Review of World Energy and Global Energy Outlook is considered one of the industry bibles, published since 1952 to provide objective data on energy markets. The markets are evolving in no small part because of the “amazing” growth in oil and gas production by the United States, said Group Chief Economist Christof Ruhl.
However, higher U.S. gas and oil prices put a bit of a damper on global gas growth.
“The natural gas market…took a breather in 2013,” said Ruhl. Coal output actually eclipsed gas output, mostly because coal prices fell for the second straight year.
“No. 1, we are still in a phase where there is little energy growth coming on,” he said. “Gas consumption increased in 2013,” but at a slower rate than in 2012.
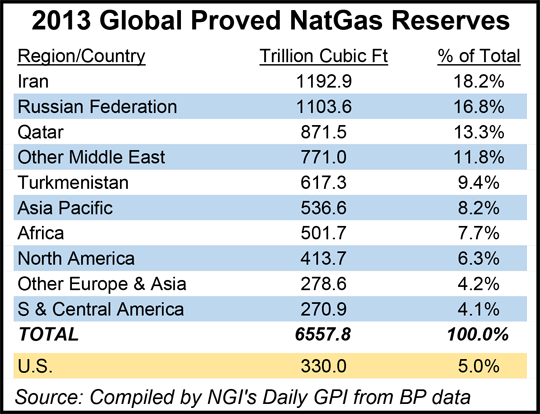
Global proven natural gas reserves at the end of 2013 totaled 6,557.8 Tcf, with North American reserves jumping to 413.7 Tcf, according to BP’s economists. The United States contributed 330 Tcf, or 5% of the world’s total. Canada’s proven gas reserves were estimated at 71.4 Tcf at the end of 2013, accounting for 1.1% of the global total, with Mexico adding 12.3 Tcf (0.2%).
North America’s natural gas reserves/production (R/P) ratio was 13, with the United States at 13.6, Canada 13.1, and Mexico, 6.1. The R/P ratio is estimated by dividing the reserves remaining at the end of a year by the production in that year, which results in the length of time that those remaining reserves would last if production were to continue at that rate.
Group CEO Bob Dudley presented the data at a Moscow energy conference.
“The world of energy in 2013 echoed broader global themes, such as emerging differences in global economic performance, geopolitical uncertainty and ongoing debates about the proper roles of government and markets,” he said. “These are important issues, and ones over which opinions vary widely, and legitimately.
“It has been said that everyone is entitled to their own opinion, but not their own facts. And that is where the Statistical Review comes in…This first snapshot of the global energy picture in 2013…can help us to understand how the world around us is changing.”
Economic growth was weak everywhere, and relative to recent history, was particularly anemic in emerging economies, according to BP. However, while global economic growth continued to soften, global energy consumption actually rose, a “remarkable uptick,” Ruhl said. Energy consumption nearly matched gross domestic product in developed countries within the Organisation for Economic Co-Operation and Development. In developing countries, “there was a remarkable slowdown, way below the 10-year average.”
Gas use declined in Europe on a stagnant economy, “but coal declined even more,” said Ruhl. Asia Pacific markets showed “more of the same, with increasing gas consumption from China.” Even so, emerging economies continued to dominate global energy demand, accounting for 80% of growth last year and nearly 100% of growth over the past decade.
Regionally, energy consumption growth was below average everywhere but North America, as the petrochemical industry turned back to the United States and increased gas consumption.
Energy production last year took a hit from geopolitical events, but the strong supply picture made merely a dent in what had once been volatile oil and gas prices. Despite the disruptions and heightened risks to supply, average oil prices were $100/bbl for the third consecutive year, higher than historically, but the price reflected reflected stable supplies brought on in growing numbers from the United States.
“Supply developments…highlighted the importance of our third topic, namely to get the balance right between policy and market forces,” said Dudley. “Driven by massive investment in shale and other tight formations, the U.S. saw the world’s largest increase in oil production last year, offsetting the numerous disruptions seen elsewhere and keeping prices stable.
“Indeed, the U.S. increase in 2013 was one of the biggest oil production increases the world has ever seen.”
Global proven natural gas reserves at the end of 2013 totaled 6,557.8 Tcf. North America’s proven reserves rose to 413.7 Tcf, with the United States contributing 330 Tcf, or 5% of the world’s total. Canada’s proven gas reserves were 71.4 Tcf at the end of 2013, accounting for 1.1% of the global total, with Mexico adding 12.3 Tcf (0.2%). North America’s reserves/production ratio was 13, with the United States at 13.6, Canada 13.1, and Mexico, 6.1. The R/P ratio is estimated by dividing the reserves remaining at the end of the year by the production in that year, which results in the length of time that those remaining reserves would last if production were to continue at that rate.
BP estimated that total North American oil production in 2013 was 16.826 million b/d, an 8.7% increase over 2012 and 18.9% of the total global output. The United States last year produced slightly more than 10 million b/d, 13.5% higher than in 2012 and 10.8% of the global total. Canada production totaled 3.95 million b/d, 6% higher year/year and 4.7% of the total. Mexico’s output was 2.88 million b/d, a decline of 1.1% from 2012 and 3.4% of the worldwide output.
Natural gas production worldwide grew by 1.1% in 2013, below the 10-year average of 2.6%, with below-average increases in every region except Europe and Eurasia.
The United States, where production was 1.3% higher than in 2012, remained the world’s leading gas producer, but Russia (2.4%) and China (9.5%) recorded larger growth increments in 2013, according to economists. Nigeria (minus 16.4%), India (minus 16.3%), and Norway (minus 5%) recorded the largest volumetric declines.
World gas consumption increased by 1.4% from 2012, below the historical average of 2.6%. As was the case for primary energy, gas consumption growth was above average in the OECD countries (1.85%) and below average in emerging economies (1.1%).
China (10.8%) and the United States (2.4%) recorded the largest growth increments in the world, together accounting for 81% of global growth. India (minus 12.2%) recorded the largest volumetric decline in the world, while European Union gas consumption fell to the lowest level since 1999.
Natural gas accounted for 23.7% of primary energy consumption for the world’s markets.
The worldwide gas trade rose by 1.8% last year, but it was well below the historical average of 5.2%. Gas pipeline shipments also were higher, up by 2.3%, driven by a 12% increase in net Russia exports, which offset declines in Canada (minus 5.5%), Norway and Algeria.
“Among importers, growth in Germany (14%) and China (32.4%) more than offset a continued decline in the United States (minus 10.9%),” said economists. The global liquefied natural gas (LNG) trade rebounded by 0.6%, with increased imports in South Korea (10.7%), China (22.9%), and South and Central American importers (44.7%) partially offsetting lower imports in Spain (minus 35.6%), the UK (minus 31.9%) and France (minus 19.4%).
Qatar remained the largest LNG exporter (32% of global exports), and accounted for the largest growth increment (2.7%). LNG’s share of global gas trade declined slightly to 31.4% — and international gas trade accounted for 30.9% of global consumption.
Dudley noted that the global picture is changing in no small part because the United States is no longer a bystander, but a full participant in global energy markets. Its dominance is coming at a particularly volatile time for the energy markets, with continuing turmoil in the energy-rich Middle East.
Coal made a comeback last year as oil and gas prices increased. With coal prices falling for two years in a row, “coal is extending its competitive edge in power generation and the competitive balance has begun to shift,” said Dudley. “Coal was the fastest-growing fossil fuel, with China and India combined accounting for 88% of global growth, while natural gas consumption growth decelerated and grew at a below-average rate.
“As was the case for total energy, gas consumption growth was below average in all regions except North America, which continues to enjoy the cheapest prices among international markets,” Dudley said.
BP economists estimated that renewables now account for more than 5% of global power output and nearly 3% of primary energy consumption.
“Once again, the data in this review shows a flexible global energy system adapting to a changing world,” the CEO said. “It demonstrates how the world’s quest for secure and fairly priced energy can be met through competitive industries driving innovation and smart government policies that amplify the creative ‘energy.’
© 2024 Natural Gas Intelligence. All rights reserved.
ISSN © 1532-1231 | ISSN © 2577-9877 | ISSN © 1532-1266 |